
09 Mar World Poverty Clock
This article covers ‘Daily Current Affairs’ and the topic details of ”World Poverty Clock”. This topic is relevant in the “Economy” section of the UPSC CSE exam.
Why in the News?
According to the recent data of the World Poverty Clock, India has successfully decreased the proportion of its population living in ‘severe poverty’ to less than 3%.
About World Poverty Clock
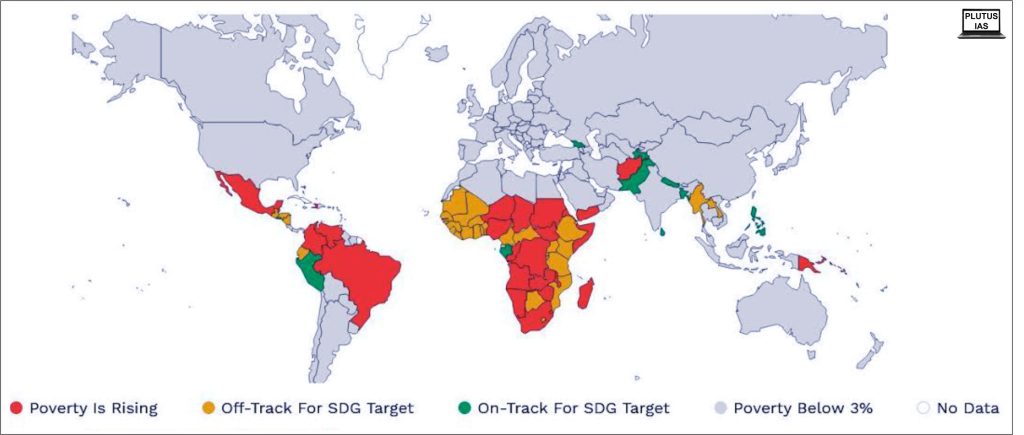
- The World Poverty Clock stands as a critical tool for monitoring progress towards the first Sustainable Development Goal (SDG) – the eradication of extreme poverty. The tool offers real-time poverty estimates for almost every country globally until the year 2030.
- It tracks advancements in achieving the United Nations’ initial Sustainable Development Goal (SDG), Ending Extreme Poverty.
- The escape rate feature calculates the ongoing rate of poverty reduction on a global scale.
- Financial support for this initiative comes from the International Fund for Agricultural Development (IFAD) and the Federal Ministry for Economic Cooperation and Development of Germany.
- The tool provides a breakdown of the number of individuals living in extreme poverty worldwide. It categorised extreme poverty by age, gender, and rural/urban location.
- This continuous data stream provides invaluable insights for policymakers, aid organisations, and researchers working to achieve the ambitious target of zero poverty by 2030.
Methodology and key findings of the report
- It calculates poverty rates based on income levels, setting the poverty threshold at USD 2.15 per day. The USD 2.15-a-day poverty line, mirroring national poverty lines in some of the most impoverished nations, is commonly referred to as the extreme poverty line.
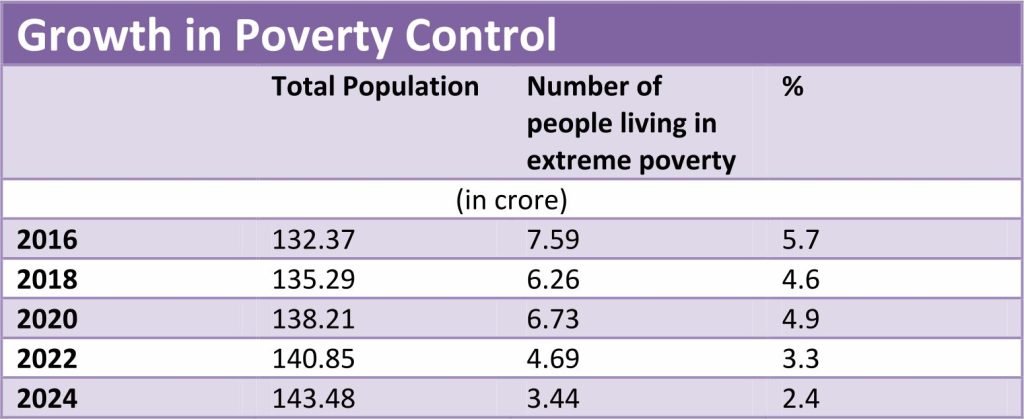
- In India, the number experiencing extreme poverty fell to roughly 3.44 crore in 2024 from 4.69 crore in 2022, accounting for 2.4% of the total population. These statistics corroborate a statement made by the CEO of NITI Aayog, based on the Household Consumption Expenditure Survey (HCES), 2022-23, asserting that less than 5% of Indians are anticipated to fall below the poverty line, with extreme destitution nearly eradicated.
Significance of the World Poverty Clock
Disaggregated Data for Targeted Solutions
- The World Poverty Clock goes beyond simply reporting headline figures. It disaggregates poverty data by age, gender, and location (rural/urban). This granular view allows for a more nuanced understanding of the issue.
- Policymakers can leverage this data to pinpoint the populations most affected by poverty and tailor interventions to address their specific needs.
- For instance, the Clock might reveal a higher poverty rate among young women in rural areas. This information would then inform the development of targeted programs focused on education, skills training, and microfinance opportunities for this specific demographic.
Measuring the Pace of Progress
- The World Poverty Clock calculates an “escape rate” that reflects the current rate of poverty reduction globally. This metric serves as a crucial indicator of progress towards achieving the SDG target.
- By analysing the escape rate, stakeholders can assess whether the world is on track to achieve the goal of eradicating extreme poverty. If the escape rate falls short of expectations, it highlights the need for more aggressive and coordinated poverty reduction efforts.
Defining and Measuring Poverty
- The World Poverty Clock employs a standardised poverty line of $2.15 per day to define extreme poverty. This threshold aligns with national poverty lines in some of the world’s poorest countries.
- Establishing a consistent measure across nations facilitates meaningful comparisons and allows for a clearer picture of the global poverty landscape. This standardised approach is crucial for ensuring that efforts to eradicate poverty are truly tackling the most severe cases across the globe.
Case Study: India’s Success Story in Poverty Reduction
- India serves as a compelling case study for the World Poverty Clock’s effectiveness. The Clock’s data indicates a substantial decline in the country’s extreme poverty rate.
- This finding aligns with the projections outlined by NITI Aayog, a government think tank, which estimates that less than 5% of the population will be below the poverty line by 2024.
- These figures suggest significant progress towards eradicating extreme poverty in India. The World Poverty Clock’s real-time data has played a role in informing policy decisions that have contributed to this success story.
NITI Aayog View onMultidimensional Poverty
- The discussion paper by NITI Aayog delves deeper than just income, exploring the concept of multidimensional poverty in India. This broader measure considers factors like health, education, and sanitation alongside income levels.
- In the discussion titled ‘Multidimensional Poverty in India since 2005-06,’ NITI Aayog reported that there has been a significant reduction in multidimensional poverty. The percentage has dropped from 29.17% in 2013-14 to 11.28% in 2022-23, leading to 24.82 crore individuals moving out of multidimensional poverty over the span of 9 years.
- The paper reports a significant reduction in multidimensional poverty over the past decade, highlighting progress beyond just economic well-being. This multifaceted approach to poverty reduction is crucial for ensuring that all individuals have the opportunity to live a dignified and fulfilling life.
Download plutus ias current affairs eng med 9th March 2024
Prelims practise question
Q1. With reference to the provisions made under the National Food Security Act, 2013, consider the following statements: (UPSC Prelims-2018)
- The families coming under the category of ‘below poverty line (BPL)’ only are eligible to receive subsidised food grains.
- The eldest woman in a household, of age 18 years or above, shall be the head of the household for the purpose of issuance of a ration card.
- Pregnant women and lactating mothers are entitled to a ‘take-home ration’ of 1600 calories per day during pregnancy and for six months thereafter.
Which of the statements given above is/are correct?
(a) 1 and 2 only
(b) 2 only
(c) 1 and 3 only
(d) 3 only
Answer: B
Q2. In the context of multidimensional poverty, consider the following statements:
- The Multidimensional Poverty Index (MPI) assesses poverty solely based on income levels.
- Children’s access to education and healthcare is not considered in measuring multidimensional poverty.
- The MPI provides a holistic understanding of poverty by examining various dimensions simultaneously.
Which of the statements given above is/are correct?
(a) 1 only
(b) 2 only
(c) 3 only
(d) 1 and 3 only
Answer: C
Mains practise questions
Q1. How does the Multidimensional Poverty Index (MPI) aid in monitoring progress over time?
I am a content developer and have done my Post Graduation in Political Science. I have given 2 UPSC mains, 1 IB ACIO interview and have cleared UGC NET JRF too.
Latest posts by Himanshu Mishra (see all)
- Accreditation of NHRC by GANHRI postponed - May 15, 2024
- Interim Bail granted to Delhi CM by Supreme Court - May 13, 2024
- Old trade route uncovered by inscription at Hoysala’s temple - May 10, 2024

No Comments