
06 Aug National and Per Capita Income in Pre-Liberalization Era
National & Per Capita Income in the Pre‑Liberalization Era (1947–1991)
This comprehensive article is aimed at UPSC CSE aspirants taking Economics as optional. It provides UPSC demanded depth on Paper 2 syllabus topic: National and Per Capita Income—patterns, trends, aggregate and sectoral composition and its changes—focused on the pre‑liberalization era.
1. Historical & Conceptual Framework
1.1 Definition of National Income & Per Capita Income
National Income (NI) refers to the total market value of final goods and services produced within the country in an accounting year. Measured as GDP or GNP. Per Capita Income is NI divided by population.
1.2 Importance in UPSC Economics Optional & Exam Scope
This topic tests aspirant’s understanding of macroeconomic aggregates and India’s growth pattern under a state-led, inward‑looking model.
2. Macroeconomic Trends: 1950s to 1980s
2.1 Growth Rates & “Hindu Rate of Growth”
Economic growth averaged ~4 % annually from 1950s to 1980s—a phenomenon termed the “Hindu rate of growth” by economist Raj Krishna to describe India’s sluggish expansion vis‑à‑vis East Asian economies
The average annual real national income growth rate: ~3.8 % (1950s), ~3.5 % (1960s), ~3.1 % (1970s), rising to ~5.5 % in the 1980s, then ~4 % in early 1990s
2.2 Per Capita Income Trend
Per Capita Income growth remained slow: starting from ~₹265 in 1950‑51 at base prices, rising modestly due to high population growth and low NI growth
2.3 Sectoral Composition of National Income
- 1950s‑60s: Agriculture dominated (~55‑60 % of GDP), Industry & Services modest.
- 1970s‑80s: Gradual structural shift to services and industry, though growth remained slow
3. Key Drivers & Features of Pre‑Liberalization Growth
3.1 State‑led Model & Planning
Characterized by Five‑Year Plans (Nehruvian socialism), import‑substitution, License‑Raj, public sector dominance and heavy regulation
3.2 Role of Population & Savings
Population grew at ≈2 % annually, tempering per capita gains. Savings & investment rates remained low (~15‑20 % of GDP) until late 1980s.
3.3 Inequality & Distributional Aspects
Income share of bottom 50 % was ~20 %, top 10 % held ~35 % in 1991
4. Quantitative Snapshot: National Income & Per Capita Figures
Exact official figures are accessible from CSO / MoSPI publications; approximate growth & trend data are:
- Real NI growth: ~3.8 % in 1950s to ~5.5 % in 1980s; early 1990s ~4 %
- Per Capita Income: ascending slowly from ₹265 (1950‑51) to ~₹700‑800 in late 1980s (in constant prices)
International comparisons: in 1947 India’s per capita income: US $439 versus US $770 in South Korea. By 1990s, South Korea’s per capita income was nearly 20× India’s
5. Pre‑Liberalization Era in Perspective: Strengths & Weaknesses
5.1 Strengths
- Import‑substitution reduced dependence on external trade.
- Strategic sectors developed in public sector.
5.2 Weaknesses
- Low growth (NI and per capita).
- Inefficient resource allocation; infrastructure gaps.
- High inequality, high poverty (~45 % incidence).
- Slow structural transformation; services and industry remained constrained.
6. Transition into Liberalization (1980s‑1991)
6.1 Policy Shifts Pre‑1991
The Sixth (1980–85) and Seventh Plans initiated deregulation, removal of price controls, rationalization of licensing—earning the tag ‘early liberalization’
6.2 Resultant Per Capita Growth Acceleration
Per capita growth accelerated to ~5.6 % in the 1980s compared to earlier decades
Best economics optional coaching for upsc
Best economics optional teacher for upsc
best economics optional test series
7. UPSC Previous Year Questions
7.1 Mains (Economics Optional Paper 2)
- Q: “Explain the meaning of the term ‘Hindu rate of growth’. Examine the causes for low national income growth in India during the pre‐1980 period.” (2017/2018/2019 themes)
- Q: “Discuss the pattern and trend of sectoral composition of national income in India from independence to the 1980s. What were the main constraints in structural transformation?”
7.2 Prelims (General Studies)
- Which of the following statements correctly describe India’s pre‑1991 economy?
- Match the following decades with approximate average NI growth rates: A) 1950–60, B) 1960–70, C) 1970–80, D) 1980–90 -> 3.8 %, 3.5 %, 3.1 %, 5.6 % respectively.
8. Probable Questions for Upcoming Exams
8.1 For Mains (GS & Optional)
Potential mains questions:
- Critically examine the patterns and determinants of per capita income growth in India during 1950‑1991.
- Analyse the sectoral trends in national income during the pre‑liberalization era and comment on their implications for economic development.
- Evaluate the causes behind the low savings‑investment‑growth nexus in India (1950–1991).
8.2 For Prelims (MCQs or Matching)**
- Which term is associated with ~4 % growth rate of Indian economy in pre‑1991 decades? (Hindu rate of growth)
- Arrange decades 1950s‑80s in descending order of per capita income growth rate.
- Identify which sector accounted for the largest share in national income during 1970‑80s.
9. Infographics & Visual Explanation
The infographics above illustrate:
- A timeline of industrial policy reforms from 1948 to 1991 (top‑left image).
- Map of states and GDP‑growth multipliers highlighting disparities (top‑right image).
- Visual comparison of policy models: Pre 1991 vs Post 1991 (bottom‑left image).
- Key thrust areas in Planning era: planning‑industrialization‑agriculture (bottom‑right image).
These colorful visuals help in quick retention and revision.
10. Mind‑Map (High‑Resolution)
The mind‑map below covers the topic holistically:
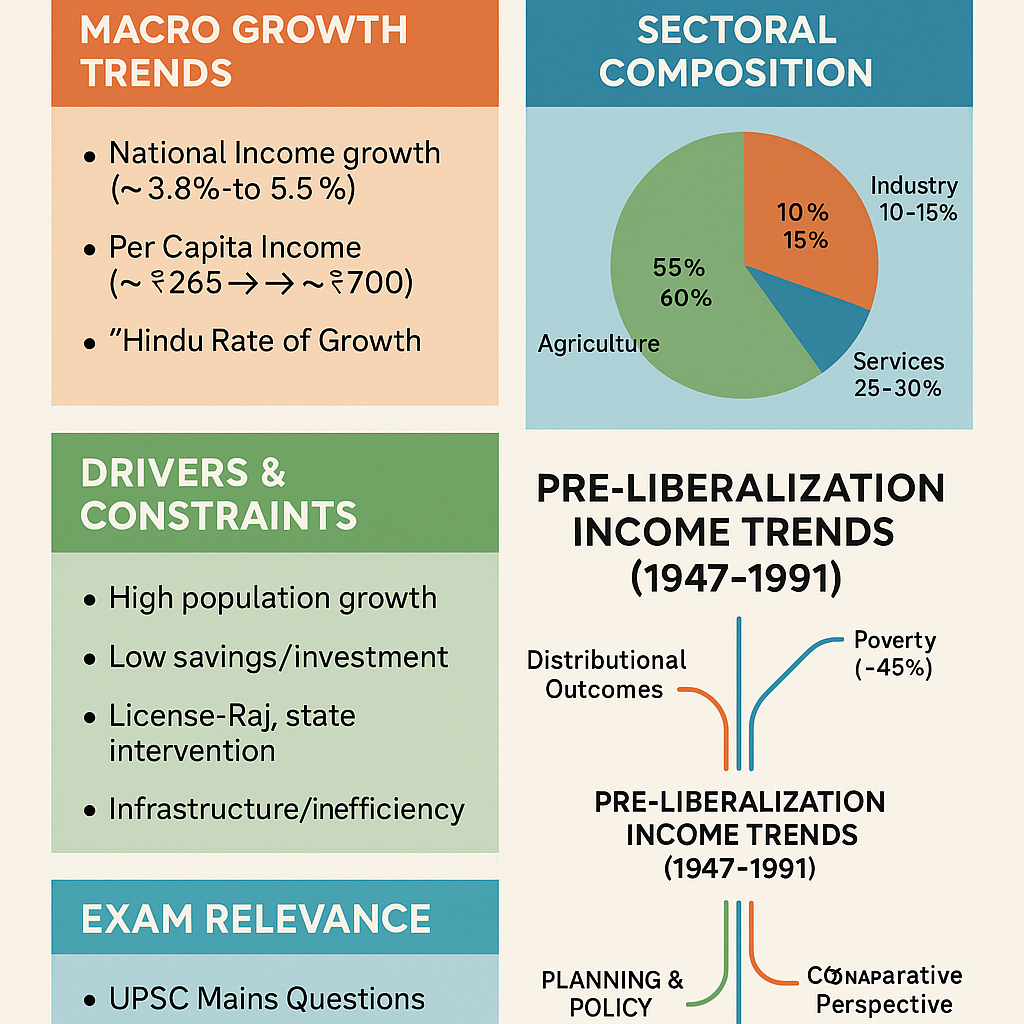
Pre‑Liberalization Income Trends (1947‑1991)
│
├─ Macro Growth Trends
│   ├─ National Income Growth (~3.8–5.5 %)
│   ├─ Per Capita Income (~₹265 → ~₹700)
│   └─ “Hindu Rate of Growth”
│
├─ Sectoral Composition
│   ├─ Agriculture (55–60 %)
│   ├─ Industry (10–15 %)
│   └─ Services (25–30 %)
│
├─ Drivers & Constraints
│   ├─ High population growth
│   ├─ Low savings/investment
│   ├─ License‑Raj, state intervention
│   └─ Infrastructure/inefficiency
│
├─ Distributional Outcomes
│   ├─ Poverty (~45 %)
│   ├─ Income share: bottom 50% ~20%, top 10% ~35%
│   └─ Rising inequality
│
├─ Planning & Policy Milestones
│   ├─ Five‑Year Plans (1950‑1990)
│   ├─ 6th & 7th plans: early reforms
│   └─ Transition to 1991 reforms
│
├─ Comparative Perspective
│   ├─ India vs South Korea, China
│   ├─ Growth divergence over decades
│   └─ Implication for development model
│
└─ Exam Relevance
    ├─ UPSC Mains Questions
    ├─ Prelims MCQs / Matching
    └─ Trends & Data for answer writing
12. Summary & Concluding Remarks
The pre‑liberalization period in India (1947–1991) was marked by slow growth, a dominant state‑led model, and a sluggish rise of per capita income. While planning laid foundations in infrastructure and public sector, the constraints of population growth, inefficiencies, low savings, and weak sectoral transformation limited economic development. The mid‑to‑late 1980s cresting towards early reforms set the stage for the dramatic shift post‑1991. For UPSC aspirants, mastering this era means understanding the patterns of NI and per capita income, sectoral trends, structural change limitations, and preparing well‑structured answers backed by data and critical analysis.
References & Further Reading
- IMF Working Paper on India in the 1980s and 1990s
- Maddison/Ashes statistics on per capita income & world economy
- Wikipedia on Economic Liberalization, Hindu rate of growth, inequality figures
-
Best ias coaching in hindi medium
- Water Resorce - November 18, 2025
- UPSC Mains 2025 Result, Download PDF and Past year cutoff analysis - November 2, 2025
- BPSC 72nd Notification 2026 Exam date and How to prepare ? - October 29, 2025

No Comments