
06 Aug Broad Factors Determining National Income and Distribution, Measures of Poverty in Pre-Liberalization Era
Broad Factors Determining National Income and Distribution, Measures of Poverty in Pre-Liberalization Era
Understanding the factors that shaped India’s national income and income distribution in the pre-liberalization era is central to evaluating the country’s economic trajectory from independence until the economic reforms of 1991. Equally important is a deep dive into how poverty was measured and conceptualized during this period.
This topic from Paper 2 of the UPSC CSE Economics Optional syllabus demands a comprehensive understanding of the structural, institutional, demographic, and policy-related forces that shaped economic development between 1950 and 1991.
1. Introduction to Pre-Liberalization Economic Framework (1950–1991)
The Indian economy in the pre-liberalization era was shaped by centralized planning, import substitution industrialization (ISI), the dominance of the public sector, and a mixed economy framework. These elements significantly influenced the national income levels and their distribution across sectors and populations.
National Income in this era grew at an average of 3.5% to 4.5% per annum, a pace often referred to as the “Hindu rate of growth.” Income distribution remained uneven, with widespread poverty and inequality despite efforts toward redistribution and social welfare.
2. Broad Factors Determining National Income in Pre-Liberalization India
2.1 Structural Composition of the Economy
- Dominance of Agriculture: Agriculture’s share in GDP was around 50-60% in the 1950s and remained above 40% until the 1980s. The low productivity in agriculture severely restricted the growth of national income.
- Low Industrial Base: Although emphasis was placed on heavy industries through the Second Five-Year Plan, the industrial sector’s contribution to national income remained below 20% until the late 1980s.
- Unorganized Sector: A large portion of the workforce was employed in the informal or unorganized sector with low productivity, leading to suppressed income generation.
- Technology Backwardness: Low R&D expenditure, poor adoption of modern technology, and inefficient use of capital hindered economic progress.
2.2 Human Capital and Demographic Pressures
- Low Literacy and Health Indicators: Human capital formation was sluggish due to inadequate investment in education and healthcare. Literacy rates in 1951 were just 18.3%, and life expectancy was under 40 years.
- Population Explosion: High birth rates led to exponential population growth (over 2% annually), offsetting gains in national income and affecting per capita income growth.
Graduation degree with IAS coaching
2.3 Policy Framework and Planning
- Socialist Orientation: Planning emphasized equity and public control over the means of production, which limited market efficiency.
- License-Permit-Quota Raj: Excessive regulations constrained private enterprise and led to inefficiencies and rent-seeking behavior.
- Import Substitution Strategy: The ISI model discouraged exports and created a protected economy that lacked global competitiveness.
2.4 Resource Constraints
- Low Domestic Savings: Gross Domestic Savings as a percentage of GDP remained below 20% until the mid-1980s, limiting investment capacity.
- Dependence on External Aid: India relied heavily on foreign aid and multilateral loans in the 1960s and 1970s, especially after the balance of payments crises.
2.5 Institutional Factors
- Weak Financial Sector Penetration: Banking infrastructure in rural areas was negligible before the 1970s.
- Inefficient Public Sector Enterprises: Loss-making PSUs were a drain on the exchequer and failed to deliver desired output and productivity.
3. Income Distribution in Pre-Liberalization Era
3.1 Features of Income Distribution
- High inequality persisted across regions, social groups, and between rural and urban sectors.
- The Gini coefficient remained high, reflecting skewed wealth concentration.
- The top 10% of the population often held over 35% of income while the bottom 50% shared less than 20%.
3.2 Determinants of Income Inequality
- Land Ownership Pattern: Concentration of land among a few households led to wide disparities in rural income.
- Urban Bias in Investment: Public investment was disproportionately directed towards urban centers and heavy industries.
- Limited Access to Credit: Small and marginal farmers lacked access to institutional finance and markets.
- Caste, Gender, and Region: Social stratification and patriarchy played major roles in unequal access to economic resources.
4. Measures of Poverty in Pre-Liberalization India
4.1 Evolution of Poverty Measurement
- Pre-1960s: No uniform definition; estimates varied between 40–70% based on calorific intake and income proxies.
- 1962 Planning Commission Approach: Set poverty line based on minimum nutritional norms (2,400 kcal for rural and 2,100 kcal for urban).
- Task Force on Projections (1979): First scientific estimation of poverty. Introduced Head Count Ratio (HCR), using NSSO data on consumption.
- Separate Rural and Urban Lines: Cost-of-living differentials were considered, leading to higher poverty estimates in rural areas.
4.2 Poverty Trends 1950–1991
- Poverty ranged between 45%–55% depending on methodology and year.
- Rural poverty remained higher due to low agricultural productivity and underemployment.
- Urban poverty, though lower in percentage, was characterized by slums, job insecurity, and migration-induced hardship.
4.3 Criticism of Poverty Estimation
- Focus solely on calorie intake ignored health, education, and sanitation.
- Infrequent data collection caused delay and misrepresentation.
- Consumption-based approach didn’t reflect true economic deprivation.
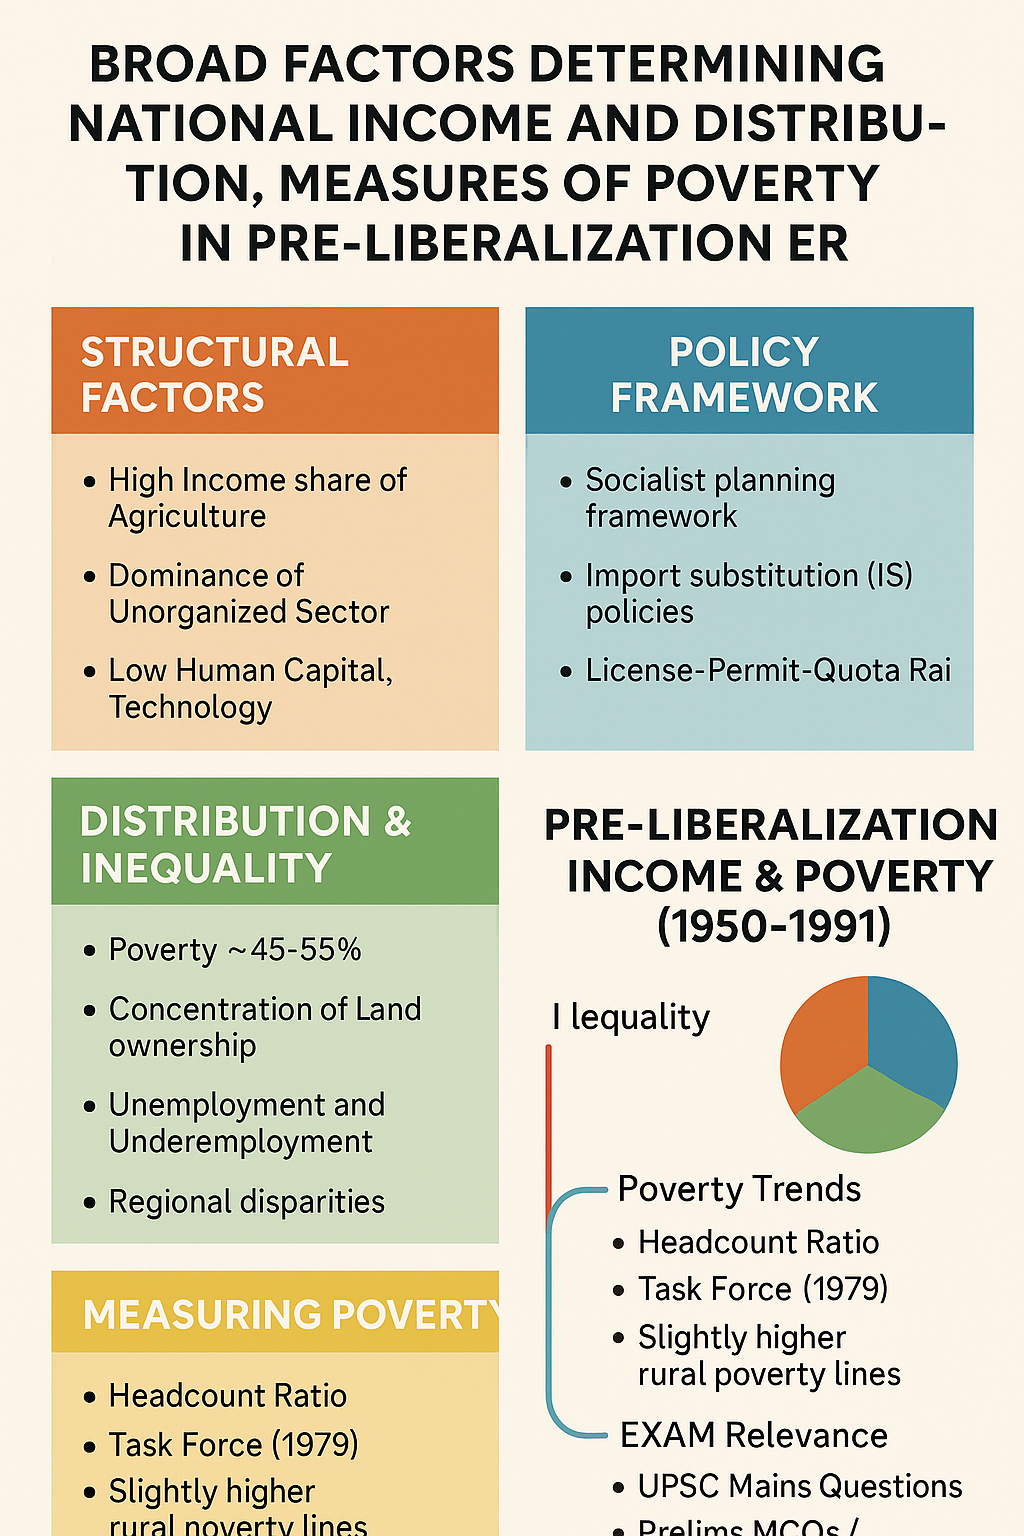
5. Mind Map: Pre-Liberalization Income & Poverty (1950–1991)
6. UPSC Previous Year Questions (PYQs)
6.1 UPSC Mains (Economics Optional Paper 2)
- Discuss the structural factors responsible for low national income growth during the planning period of India. (2018)
- Examine the evolution of poverty measurement methods in India. Critically evaluate their effectiveness in pre-liberalization India. (2020)
- Explain the nature and pattern of income distribution in India during the planning era. (2019)
6.2 UPSC Prelims (General Studies)
- Which of the following best describes the poverty line used in India before liberalization? [a] Asset-based [b] Calorie intake [c] Wealth ownership [d] Employment status
- During the 1970s and 1980s, what was the average rate of economic growth in India? [a] 2.1% [b] 3.2% [c] 4.8% [d] 6.2%
Best economics optional coaching for upsc
Best economics optional teacher for upsc
best economics optional test series
7. Probable Questions for UPSC
7.1 Mains
- Critically evaluate the role of demographic and policy factors in shaping India’s national income between 1950 and 1991.
- Discuss the effectiveness of poverty measurement techniques during the planning era in India. Suggest alternative indicators.
- How did institutional and structural bottlenecks impact income distribution in India before 1991?
7.2 Prelims
- What was the role of the 1979 Task Force in India’s poverty estimation methodology?
- Which of the following sectors contributed most to India’s GDP in 1950s? [a] Agriculture [b] Industry [c] Services [d] Trade
8. Conclusion
The pre-liberalization era of the Indian economy was characterized by sluggish growth in national income, limited per capita gains, and wide disparities in income distribution. Poverty remained high due to structural bottlenecks and inefficient policies. Despite best efforts by planners, the rigid regulatory framework failed to unlock the country’s full economic potential.
Understanding this historical economic phase is essential for UPSC aspirants to connect the dots between past economic strategies and present reforms, and to present well-informed answers in the examination.
9. SEO Tags (Comma Separated)
UPSC Economics Optional, National Income Determinants, Income Distribution India, Pre-Liberalization Economy, Indian Economy 1950-1991, Planning Era UPSC, License Raj, Poverty Estimation UPSC, UPSC PYQs Economics, UPSC Economics Paper 2 Notes, Factors Affecting National Income

No Comments