


15 Sep UPSC Exam Focus: PLFS August 2026 Key Highlights on Employment Trends
✎ The Periodic Labour Force Survey (PLFS) is a monthly survey by the NSO that tracks key labour market indicators such as LFPR, WPR, and UR, providing critical data for employment policy formulation and economic analysis.
Subject Relevance — Where This Topic Fits
- GS Paper III — Indian Economy: Issues relating to Planning, Mobilisation of Resources, Growth, Development and Employment
- Prelims: Periodic Labour Force Survey (PLFS), Labour Force Participation Rate (LFPR), Worker Population Ratio (WPR), Unemployment Rate (UR), National Statistical Office (NSO), Ministry of Statistics and Programme Implementation (MoSPI), CWS (Current Weekly Status)
- Essay: Economic Reforms and Employment Generation in India: Challenges and Opportunities
Quick Revision: The Periodic Labour Force Survey (PLFS) is a monthly survey by the NSO that tracks key labour market indicators such as LFPR, WPR, and UR, providing critical data for employment policy formulation and economic analysis.
Why is this in the news?
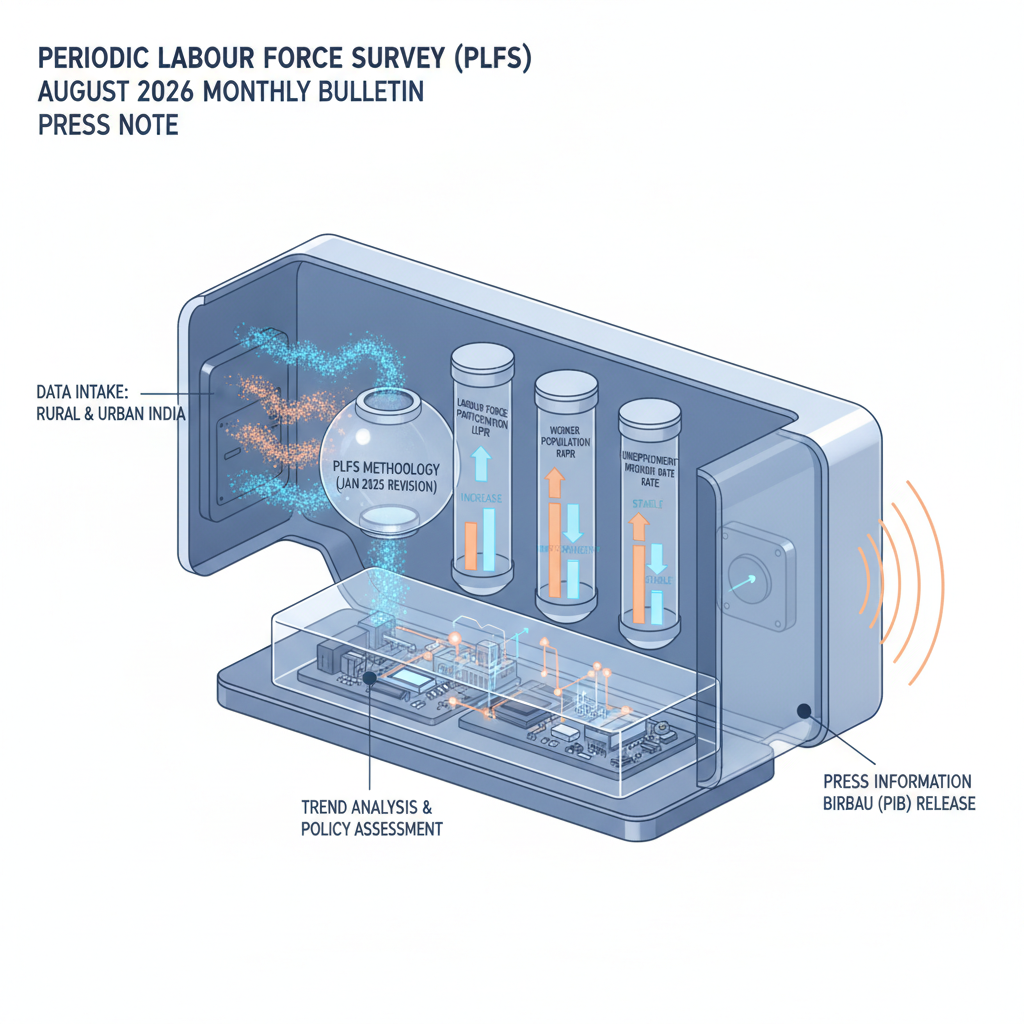
The Press Information Bureau (PIB) released the August 2026 monthly bulletin of the Periodic Labour Force Survey (PLFS), highlighting key trends in labour force participation, employment, and unemployment across rural and urban India. The data reveals a marginal increase in the overall Labour Force Participation Rate (LFPR) and a notable improvement in rural employment metrics, while urban LFPR remains stable. These trends are critical for assessing the effectiveness of employment generation policies and understanding the structural dynamics of India’s labour market.
Background
- From January 2025, the PLFS methodology was revised to include monthly bulletins, offering more frequent and timely estimates of key labour indicators such as LFPR, Worker Population Ratio (WPR), and Unemployment Rate (UR).
- The PLFS uses the Current Weekly Status (CWS) approach to capture the employment status of individuals during the reference week, ensuring a robust and standardised measurement of labour force indicators.
- The survey covers all states and union territories, providing disaggregated data for rural and urban areas, which is essential for targeted policy interventions.
- The LFPR, WPR, and UR are internationally recognised indicators used to assess the health of an economy’s labour market and guide employment policies.
- The PLFS data is utilised by policymakers, researchers, and analysts to evaluate the impact of economic policies, identify employment trends, and design interventions for inclusive growth.
What is the Periodic Labour Force Survey (PLFS)?
- The PLFS is a comprehensive survey conducted by the National Statistical Office (NSO), under the Ministry of Statistics and Programme Implementation (MoSPI), to measure the employment and unemployment status of India’s workforce.
- It provides estimates of key labour market indicators such as the Labour Force Participation Rate (LFPR), Worker Population Ratio (WPR), and Unemployment Rate (UR) at both national and state levels.
- The survey uses the Current Weekly Status (CWS) approach, which classifies individuals based on their employment status during the reference week, ensuring consistency and comparability with international standards.
- The PLFS was introduced to address the limitations of the earlier Employment-Unemployment Survey (EUS) by providing more frequent and granular data, including monthly bulletins since January 2025.
- The LFPR measures the proportion of the working-age population (15 years and above) that is either employed or actively seeking work, reflecting the engagement of the population in economic activities.
- The WPR indicates the percentage of the working-age population that is engaged in any economic activity, providing insights into the actual employment scenario.
- The UR represents the percentage of the labour force that is unemployed but actively seeking employment, serving as a key indicator of labour market slack.
- The PLFS data is crucial for assessing the impact of economic policies, identifying structural issues in the labour market, and designing evidence-based interventions for employment generation and skill development.
Key Features
| Feature | Significance |
|---|---|
| Labour Force Participation Rate (LFPR) – Overall (15+ years) | Indicates the proportion of working-age population engaged in economic activities, reflecting labour market dynamism and economic engagement. |
| Rural LFPR (15+ years) | Demonstrates increased economic participation in rural areas, suggesting rural livelihood resilience and potential agricultural or allied sector growth. |
| Urban LFPR (15+ years) | Shows stability in urban labour market participation, indicating structural consistency in urban employment ecosystems. |
| Workforce Participation Rate (WPR) – Overall (15+ years) | Measures the proportion of working-age population actually employed, providing a direct indicator of employment absorption. |
| Unemployment Rate (UR) – Overall (15+ years) | Reflects the percentage of labour force unable to secure employment despite willingness to work, critical for assessing job market tightness. |
Why it Matters
Economic Policy & Labour Market Dynamics
- The sustained rise in LFPR and WPR signals improving labour market absorption, which is pivotal for inclusive growth and poverty reduction strategies.
- A declining rural unemployment rate (4.1% in August 2026) suggests targeted rural employment interventions or agricultural productivity gains.
- Stability in urban LFPR and unemployment rate indicates structural equilibrium in urban labour markets, though stagnation in female urban participation warrants attention.
- The data provides empirical basis for designing skill development programmes (e.g., PMKVY) and rural employment schemes (e.g., MGNREGS) to align supply with demand.
Gender Disparities in Labour Force Participation
- The 1.1 percentage-point increase in female LFPR (34.8% in August 2026) reflects gradual progress in women’s economic empowerment, though gaps persist across rural-urban divides.
- Rural female LFPR (39.4%) significantly outpaces urban (25.4%), highlighting the role of agricultural and informal sector opportunities in rural areas.
- Persistent urban-rural divide in female participation underscores the need for targeted policies addressing urban infrastructure (e.g., childcare, transport) and skill gaps.
Data-Driven Governance & Statistical Systems
- PLFS, conducted by NSO under MOSPI, exemplifies India’s commitment to high-frequency, granular labour market data for evidence-based policymaking.
- Monthly bulletins enable real-time monitoring of labour market trends, facilitating adaptive policy responses to emerging challenges (e.g., automation, migration).
- The transition to monthly estimates (since January 2025) enhances the timeliness and relevance of labour statistics for budgetary and welfare planning.
Challenges
1. Structural Urban-Rural Divide in Female Labour Participation
- Urban female LFPR remains stagnant at 25.4%, suggesting systemic barriers such as lack of safe transport, childcare facilities, or skill mismatches in formal sectors.
- Policy interventions must address urban-specific constraints (e.g., workplace safety, flexible work arrangements) to unlock female labour potential.
UPSC Link: GS Paper 3: Employment
2. Informal Sector Dominance & Underemployment
- High WPR alongside moderate UR may mask underemployment or low-productivity jobs, particularly in rural areas where agricultural work dominates.
- Data does not distinguish between formal/informal employment, limiting insights into decent work conditions and wage growth.
UPSC Link: GS Paper 3: Informal Sector
3. Skill Mismatch & Youth Unemployment
- While overall UR is stable, youth-specific data (not provided here) may reveal hidden unemployment or underutilisation of human capital.
- Vocational training programmes must align with industry demands to reduce skill gaps and enhance employability.
UPSC Link: GS Paper 3: Skill Development
4. Data Gaps in Inter-State Comparisons
- PLFS provides national and rural-urban aggregates but lacks granularity for state-level analysis, critical for federal policy design.
- Sub-national disparities (e.g., Kerala vs. Bihar) may require supplementary surveys or administrative data integration.
UPSC Link: GS Paper 2: Federalism
5. Seasonal Employment Fluctuations
- Monthly data may not capture seasonal variations (e.g., agricultural cycles), leading to potential misinterpretation of labour market trends.
- Tri-monthly PLFS reports (not monthly) could mitigate this, but monthly bulletins remain valuable for short-term monitoring.
UPSC Link: GS Paper 3: Seasonal Employment
Challenges — UPSC Perspective
| Issue | Concern |
|---|---|
| Urban Female Participation Stagnation | Limited access to formal employment opportunities and workplace infrastructure. |
| Rural-Urban Disparity in WPR | Structural differences in economic opportunities and infrastructure between regions. |
| Lack of Informal Sector Data | Inability to assess decent work conditions and productivity in the unorganised sector. |
| Seasonal Employment Variability | Monthly data may obscure cyclical trends in agricultural and allied sectors. |
| State-Level Data Gaps | Limited granularity for designing targeted state-specific employment policies. |
Way Forward
- Enhance urban female labour participation through targeted infrastructure investments (e.g., safe transport, childcare centres) and skill-upgradation programmes.
- Integrate PLFS data with state employment exchanges to align skill development (PMKVY, NSDC) with local labour market demands.
- Expand PLFS to include informal sector metrics and wage disbursement data for a holistic employment assessment.
- Leverage monthly PLFS bulletins to design adaptive rural employment schemes (e.g., MGNREGS) with seasonal flexibility.
- Conduct state-specific labour market studies to identify regional disparities and inform federal policy interventions.
- Promote public-private partnerships to create formal sector jobs in urban areas, particularly for women and youth.
- Strengthen data dissemination mechanisms to ensure accessibility for researchers, policymakers, and civil society.
UPSC Value Addition
Keywords for Mains Answer-Writing
Periodic Labour Force Survey (PLFS) · Labour Force Participation Rate (LFPR) · Worker-Population Ratio (WPR) · Unemployment Rate (UR) · National Statistical Office (NSO) · Ministry of Statistics and Programme Implementation (MoSPI) · Rural-urban divide in employment · Female Labour Force Participation · Economic indicators of employment · Monthly Bulletin of PLFS · Trends in employment statistics · Macro-economic indicators · Labour market dynamics · Statistical governance
Concept Flow
Economic Growth → Labour Demand → Increased LFPR/WPR → Reduced Unemployment → Rural-Urban Migration → Urban Labour Supply → Stable Urban LFPR/UR → Structural Urban Employment Equilibrium → Agricultural Productivity → Rural Employment → Declining Rural Unemployment → Enhanced Rural LFPR → Female Labour Force Participation → Gender Equality Policies → Targeted Urban Infrastructure → Stagnant Urban Female LFPR → Informal Sector Dominance → Underemployment → High WPR but Low Productivity → Need for Formalisation Policies → Monthly PLFS Data → Real-Time Policy Adjustments → Evidence-Based Employment Strategies → Sustainable Growth
Prelims Practice Questions
Q1. Consider the following statements regarding the Periodic Labour Force Survey (PLFS) in India:
1. PLFS is conducted by the National Statistical Office (NSO) under the Ministry of Statistics and Programme Implementation (MoSPI).
2. PLFS provides monthly and quarterly estimates of labour market indicators such as LFPR, WPR, and UR.
3. The survey methodology of PLFS was revised in January 2024 to include only urban areas.
4. The PLFS monthly bulletin is released with a lag of two months from the reference month.
How many of the above statements are correct?
- Only one
- Only two
- Only three
- All four
Answer: Only three — Statements 1 and 2 are correct. Statement 3 is incorrect as the PLFS methodology was revised in January 2025, not 2024. Statement 4 is incorrect as the PLFS monthly bulletin is released with a lag of one month from the reference month.
Q2. Assertion (A): The Labour Force Participation Rate (LFPR) in rural areas for persons aged 15 years and above showed a year-on-year increase in August 2026.
Reason (R): The LFPR in rural areas increased from 57.0% in August 2025 to 58.2% in August 2026, reflecting a 1.2 percentage point rise.
- Both A and R are true, and R is the correct explanation of A
- Both A and R are true, but R is NOT the correct explanation of A
- A is true, but R is false
- A is false, but R is true
Answer: Both A and R are true, and R is the correct explanation of A — Both the Assertion (A) and Reason (R) are true, and the Reason (R) correctly explains the Assertion (A) as it provides the exact data supporting the increase in LFPR in rural areas.
Q3. Match the following labour market indicators with their respective definitions:
Column I
A. Labour Force Participation Rate (LFPR)
B. Worker-Population Ratio (WPR)
C. Unemployment Rate (UR)
Column II
1. The proportion of workers in the population, expressed as a percentage.
2. The percentage of persons in the labour force who are unemployed but seeking and available for work.
3. The percentage of persons in the working-age population who are either employed or unemployed and seeking work.
Select the correct match:
- A-3, B-1, C-2
- A-1, B-2, C-3
- A-2, B-3, C-1
- A-3, B-2, C-1
Answer: A-3, B-1, C-2 — A matches with 3 (LFPR is the percentage of persons in the working-age population who are either employed or unemployed and seeking work). B matches with 1 (WPR is the proportion of workers in the population). C matches with 2 (UR is the percentage of persons in the labour force who are unemployed but seeking and available for work).
Mains Practice Question
✍ The Periodic Labour Force Survey (PLFS) serves as a critical tool for assessing the dynamics of India’s labour market. In this context, critically examine the significance of PLFS in policy formulation and governance. Also, analyse how the trends in Labour Force Participation Rate (LFPR), Worker-Population Ratio (WPR), and Unemployment Rate (UR) as reported in the August 2026 PLFS bulletin reflect the structural challenges and opportunities in India’s employment landscape. (15 Marks)
Approach: MODEL-ANSWER SKELETON:
1. **Introduction (2 marks)**
– Define PLFS and its institutional framework (NSO under MoSPI).
– State its objective: to provide monthly and quarterly estimates of labour market indicators.
– Mention the revision in methodology (January 2025) and the frequency of data release.
2. **Significance of PLFS in Policy Formulation (5 marks)**
– **Evidence-based policymaking**: PLFS data informs the design and evaluation of employment-centric schemes (e.g., MGNREGA, PMKVY, Aatmanirbhar Bharat Rozgar Yojana).
– **Targeted interventions**: Data on rural-urban and gender disparities helps tailor policies (e.g., women’s employment, skilling programs).
– **Monitoring SDGs**: Aligns with SDG 8 (Decent Work and Economic Growth) and SDG 5 (Gender Equality).
– **Macro-economic stability**: Provides inputs for monetary and fiscal policies (e.g., RBI’s bi-monthly monetary policy reviews).
– **Comparative analysis**: Enables benchmarking with international labour market indicators.
3. **Analysis of August 2026 Trends (5 marks)**
– **Labour Force Participation Rate (LFPR)**:
– Aggregate LFPR (55.6% in August 2026) shows marginal improvement but remains below global averages.
– Rural LFPR (58.2%) higher than urban (50.4%), indicating structural rural employment dependence.
– Female LFPR (34.8%) shows year-on-year growth, but urban female LFPR remains stagnant (~25%).
– **Worker-Population Ratio (WPR)**:
– Aggregate WPR (52.8%) is the highest since March 2026, reflecting increased employment absorption.
– Rural WPR (55.8%) outpaces urban WPR, underscoring the role of agriculture and allied sectors.
– **Unemployment Rate (UR)**:
– Aggregate UR (5.0%) stable, but rural UR (4.1%) at a five-year low, suggesting improved rural employment absorption.
– Urban UR remains higher, reflecting structural urban unemployment challenges.
4. **Structural Challenges and Opportunities (3 marks)**
– **Challenges**:
– Persistent urban unemployment despite economic growth.
– Low female LFPR in urban areas due to socio-cultural barriers and lack of formal job opportunities.
– Informal sector dominance (not explicitly covered in PLFS but inferred from WPR trends).
– **Opportunities**:
– Rising rural LFPR and WPR indicate agricultural and allied sector resilience.
– Policy focus on women’s employment (e.g., Stand-Up India, MUDRA) can leverage the increasing female LFPR.
– PLFS data can guide skill development programs to match labour supply with industry demands.
5. **Conclusion (2 marks)**
– PLFS is indispensable for evidence-based governance but must be complemented with qualitative labour market studies.
– Addressing data gaps (e.g., informal sector, gig economy) and ensuring timely dissemination are critical for effective policy implementation.
Source: PIB (Press Information Bureau)
Generated by AanyaAi for educational purpose.
Related guides on our sites
- Current affairs for upsc 2026
- Best PSIR optional coaching for upsc
- Best economics optional coaching for upsc
- Best PSIR optional teacher for upsc

- किशाऊ बहुउद्देशीय परियोजना: 6 राज्यों के बीच ऐतिहासिक समझौता, जानें पूरा विवरण - September 15, 2026
- 6 राज्यों ने किया किशाऊ परियोजना समझौते पर हस्ताक्षर, जानें पूरा विवरण - September 15, 2026
- पीएलएफएस अगस्त 2026: श्रम भागीदारी दर में वृद्धि, बेरोजगारी में गिरावट - September 15, 2026

No Comments