
31 Aug Energy Policy Institute at the University of Chicago (EPIC) and Air qulaity index 2024
Syllabus mapping:
GS-3 -Biodiversity &Environment: Energy Policy Institute at the University of Chicago (EPIC) and Air qulaity index 2024
FOR PRELIMS:
What is energy policy institute at the university of chiacago in context of AQI? What is energy policy institute at the university of chiacago in context of AQI?
FOR MAINS:
How do the 2024 findings from the Air Quality Life Index (AQLI) highlight the relationship between air pollution and life expectancy, and what implications do these findings have for global public health policies and environmental regulations?
RECENT CONTEXT:
The is an important metric developed by the Energy Policy Institute at the University of Chicago (EPIC) to measure the impact of air pollution on life expectancy. The AQLI provides an estimate of how much air pollution shortens life expectancy in different regions,permanently reducing global PM2.5 air pollution to meet the World Health Organization (WHO) guideline would add 2.3 years onto average human life expectancy or a combined 17.8 billion life years saved For 2024, the AQLI will likely continue to offer insights into global and regional air quality trends, highlighting areas where air pollution is most severe and its effects on public health. It typically includes data on various countries, cities, and regions, showing improvements or deteriorations in air quality and their corresponding impacts on life expectancy.
“By converting air pollution concentrations into tangible terms—its impact on life expectancy—the AQLI establishes particulate air pollution as the single greatest threat to human health globally.” – Michael Greenstone, EPIC
Specifically,the AQLI stands apart from most work in this space in a few important respects:
- The research underlying the AQLI is based on pollution data at the very high concentrations that prevail in many parts of the world today. Previous work has relied on extrapolations of associational evidence from the low levels in the United States or on extrapolations from cigarette studies.
- The causal nature of the AQLI’s underlying research allows it to isolate the effect of air pollution from other factors that impact health. In contrast,previous efforts to summarize the health effects of air pollution have relied on associational studies that are prone to confounding the effects of air pollution with other determinants of human health.
- The AQLI delivers estimates of the loss of life expectancy for the average person. Other approaches report the number of people who die prematurely due to air pollution, leaving unanswered how much their life was cut short or if they were more predisposed to be impacted from it (e.g. elderly or sick).
Energy Policy Institute at the University of Chicago (EPIC)
What is the Air Quality Life Index (AQLI)?
- The AQLI is a pollution index that translates the effect of particulate air pollution into its impact on life expectancy.
- The Index then combines the relationship between long-term human exposure to air pollution and life expectancy to provide the true cost of particulate pollution in communities around the world.
- The Index also illustrates how air pollution policies can increase life expectancy when they meet the WHO’s guideline for what is considered a safe level of exposure, existing national air quality standards, or user-defined air quality levels.
About the Air Quality Life Index (AQLI)?
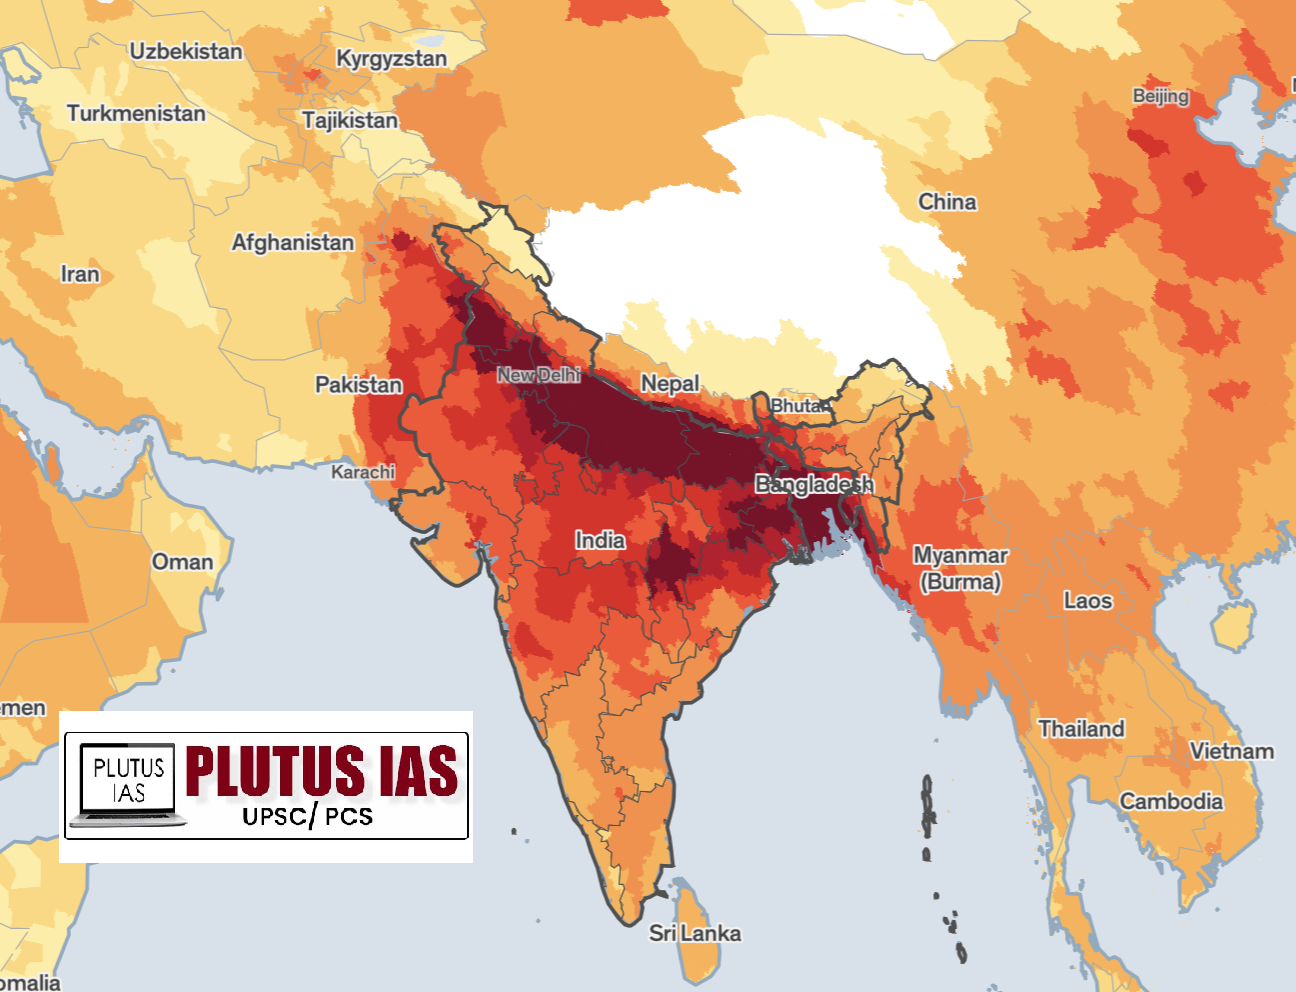
- India is the world’s second most polluted country. Fine particulate air pollution (PM2.5) shortens an average Indian’s life expectancy by 5.3 years, relative to what it would be if the World Health Organization (WHO) guideline of 5 µg/m3 was met. Some areas of India fare much worse than average, with air pollution shortening lives by 11.9 years in the National Capital Territory of Delhi, the most polluted city in the world.
Global Scenario:
- US, China, Europe: The United States, Europe, and China have implemented stringent policies,leading to significant reductions in pollution levels.
- In China, air pollution has decreased by 41% since 2014 and extended the life of Chinese by 2 years.
- The US has reduced pollution by 67.2% since 1970, extending the average lifespan by 1.5 years.
- Despite this improvement, South Asia remains the world’s most polluted region, accounting for 45% of global life years lost due to high pollution.
- Bangladesh, India, Nepal, and Pakistan are the most polluted countries globally.
- In Myanmar air pollution is reducing life expectancy by 2.9 years.
- Africa: Air pollution in Central and West Africa has remained largely unchanged in 2022.
- The region’s average PM2.5 concentration is 22.2 micrograms per cubic meter (μg/m3), 4.4 times higher than the WHO guideline.
- Nigeria,Rwanda and Ghana have recently implemented air quality regulations and standards.
- West Asia: Middle East and North Africa (MENA) region has emerged as a new pollution reducing life expectancy by an average of 1.3 years across the region.
- Qatar and Iraq are the most polluted countries in the region.
- Cities like Bogotá, Mexico City, and Quito implement driving restrictions in city.
How Can We Control Air Pollution?
- Prevention: Adopt pollution prevention approaches to reduce, eliminate, or prevent pollution at its source.
- Examples are to use less toxic raw materials or fuels, use a less-polluting industrial process, and to improve the efficiency of the process. E.g., BSVI engine.
- Adoption of Clean Air Technology: Air pollution prevention and control technologies can help in controlling air pollution.
- It includes wet scrubbers,fabric filters (baghouses),electrostatic precipitators,condensers, absorbers,adsorbers,and biological degradation.
- Economic Incentives: Economic incentives such as emissions trading and emissions caps can be used for polluting industries.
- Scrapping Old Vehicles: Scrapping of the current End-of-life vehicles (ELVs) burden of the country will lead to 15-20% reduction in emissions due to vehicular pollution.
- Work-from-Home: To combat air pollution, the government may promote work-from-home policies during high pollution days like winters.
- Artificial Rain: It can wash away pollutants that are suspended in the air,such as particulate matter (PM),nitrogen oxides (NOx),and sulphur dioxide (SO2).
- Behavioural Change: Promoting the use of public transportation,walking, and cycling can reduce the number of individual vehicles on the road,leading to lower emissions and lower air pollution.
Government Initiatives Taken for Controlling Air Pollution
Regulatory Measures:
- Emission Standards: Governments often set limits on emissions from vehicles, industrial processes, and power plants. For example, the U.S. Environmental Protection Agency (EPA) enforces standards for pollutants like sulfur dioxide (SO₂), nitrogen oxides (NOx), and particulate matter (PM2.5).
- Air Quality Standards: Regulatory bodies establish air quality standards to protect public health. For instance, the World Health Organization (WHO) and various national agencies have set guidelines for acceptable levels of pollutants.
- Clean Air Acts: Many countries have comprehensive legislation aimed at reducing air pollution. For example, the Clean Air Act in the United States mandates regulatory measures to control air pollution and improve air quality.
Technological Advancements:
- Promoting Clean Energy: Governments encourage the use of renewable energy sources such as wind, solar, and hydroelectric power to reduce reliance on fossil fuels, which are major sources of air pollution.
- Vehicle Emission Controls: Implementation of stricter emission standards for vehicles, such as those mandated by the Euro standards in Europe or the Corporate Average Fuel Economy (CAFE) standards in the U.S., helps reduce pollutants from transportation.
- Pollution Control Technologies: Investment in technologies like scrubbers, catalytic converters, and filters helps industries and power plants reduce their emissions.
Public Awareness and Education:
- Public Campaigns: Governments and NGOs run awareness campaigns to educate the public about the health impacts of air pollution and ways to reduce personal contributions, such as using public transportation or reducing energy consumption.
- Air Quality Index (AQI): Many countries have systems to provide real-time air quality information to the public, helping people make informed decisions about outdoor activities.
Recent Initiatives and Innovations:
- Air Quality Monitoring Networks: Expansion of air quality monitoring networks provides more comprehensive data on pollution levels and helps target interventions more effectively.
- Green Technology Incentives: Some governments offer subsidies or incentives for the adoption of green technologies, such as electric vehicles and solar panels.
- Legislation for Low-Emission Zones: Establishing low-emission zones in cities restricts access to vehicles that exceed certain emission limits, improving urban air quality.
What are the Government Initiatives Taken for Controlling Air Pollution?
System of Air Quality and Weather Forecasting and Research (SAFAR) Portal
- SAFAR, or System of Air Quality and Weather Forecasting and Research, is an initiative developed by the Indian Ministry of Earth Sciences (MoES) to provide real-time air quality monitoring and forecasting in India. Here’s a concise overview of SAFAR:
Purpose and Function
- Air Quality Monitoring: SAFAR continuously monitors air quality across various Indian cities, providing real-time data on pollutants such as PM2.5, PM10, NO2, SO2, CO, and ozone.
- Forecasting: The system forecasts air quality and weather conditions up to three days in advance, helping citizens and authorities prepare for and respond to pollution events.
- Public Information: SAFAR provides accessible information through its website and mobile app, including Air Quality Index (AQI) values, health advisories, and pollution forecasts.
Components
- Monitoring Stations: SAFAR includes a network of air quality monitoring stations strategically placed across major cities in India. These stations collect data on various pollutants and meteorological parameters.
- Data Integration: The system integrates air quality data with weather forecasts to provide a comprehensive view of pollution trends and potential impacts.
- Mobile and Web Platforms: SAFAR offers tools for the public to access real-time air quality information, forecasts, and health recommendations.
Impact and Benefits
- Public Health: By providing timely information on air quality, SAFAR helps individuals make informed decisions about outdoor activities and take precautions to protect their health.
- Policy Support: The data generated by SAFAR supports policymakers and environmental agencies in designing and implementing air quality management strategies.
National Air Quality Monitoring Programme (NAMP)
The National Air Quality Monitoring Programme (NAMP) is an initiative by the Indian government aimed at assessing and managing air quality across India. Here’s a concise summary:
Purpose and Objectives
- Air Quality Assessment: NAMP monitors and assesses the levels of air pollutants in various cities and regions to gauge air quality and its impact on health and the environment.
- Data Collection and Analysis: The program collects data on key pollutants, such as PM2.5, PM10, NO2, SO2, CO, and ozone, to analyze trends and patterns in air quality.
- Policy and Planning Support: The data supports environmental policies, regulatory measures, and urban planning to mitigate air pollution and improve air quality.
Components
- Monitoring Stations: NAMP operates a network of air quality monitoring stations across cities and towns in India, which measure pollution levels in real time.
- Data Reporting: The program provides regular reports and updates on air quality, including the Air Quality Index (AQI), which helps inform the public and policymakers.
- Coordination: NAMP is coordinated by the Central Pollution Control Board (CPCB) in collaboration with various state pollution control boards and other agencies.
Impact and Benefits
- Public Awareness: By providing real-time air quality data, NAMP helps raise awareness among the public about pollution levels and health risks.
- Regulatory Measures: The program’s data aids in enforcing air quality standards and developing strategies to reduce pollution.
- Research and Development: NAMP supports research on air quality trends, pollution sources, and their effects, contributing to better environmental management and policy-making.
Graded Response Action Plan (for Delhi)
The Graded Response Action Plan (GRAP) for Delhi is a framework designed to address air pollution in a systematic and tiered manner, depending on the severity of pollution levels. Here’s a brief overview:
Purpose
- To Manage Air Quality: GRAP provides a structured approach to tackle air pollution by implementing specific actions based on the Air Quality Index (AQI) levels.
- To Mitigate Health Impacts: The plan aims to protect public health by reducing exposure to harmful air pollutants during high pollution episodes.
Key Components
- Action Levels: GRAP categorizes air pollution into various levels, from “Moderate” to “Severe” and “Severe Plus,” with corresponding actions required for each level.
- Emergency Measures: For extreme pollution levels, GRAP prescribes emergency measures like restricting construction activities, increasing public transportation, and enforcing stricter vehicle emission standards.
- Implementation Agencies: The plan is implemented by various government agencies, including the Delhi Pollution Control Committee (DPCC), the Central Pollution Control Board (CPCB), and local municipal authorities.
Actions by Pollution Level
- Moderate to Poor: Measures include improving traffic management, controlling dust, and promoting cleaner fuels.
- Very Poor: Includes actions like increasing the frequency of mechanical road sweeping and controlling industrial emissions.
- Severe: Implements stricter measures such as banning construction activities, restricting vehicle use, and enforcing stricter emission norms.
- Severe Plus (Emergency): Includes emergency measures like closure of schools, work-from-home directives, and stopping non-essential construction and industrial activities.
Goals and Benefits
- Reduce Pollution: The plan aims to quickly reduce pollution levels during severe episodes.
- Protect Health: By implementing timely measures, GRAP helps minimize health risks associated with poor air quality.
- Improve Air Quality Management: Provides a framework for effective and responsive air quality management.
CONCLUSION:
EPIC’s AQLI for 2024 provides critical data that connects air quality to life expectancy, supporting informed decision-making and action to combat air pollution. The ongoing work of EPIC underscores the importance of addressing air quality issues to improve public health and quality of life globally.Meeting WHO guidelines could significantly enhance life expectancy and overall public health nationwide.
Download plutus ias current affairs eng med 31st Aug 2024
PRELIMS QUESTION:
Q.As of 2024, which pollutant is primarily used in the AQLI to estimate reductions in life expectancy
- A) Carbon Dioxide (CO2)
- B) Nitrogen Dioxide (NO2)
- C) Particulate Matter (PM2.5)
- D) Sulfur Dioxide (SO2)
Answer: C
MAINS QUESTION:
Q. Air pollution is a significant public health challenge in India, impacting life expectancy and quality of life. Suggest additional strategies to achieve sustainable air quality improvement.
No Comments