
27 Jul Welfare Indicators and Measures of Growth
Welfare Indicators and Measures of Growth – UPSC Economics Optional Paper 1
In the study of economic development, it is important to go beyond traditional metrics like GDP and examine how growth translates into human well-being. The topic “Welfare Indicators and Measures of Growth” forms an essential part of the UPSC Economics Optional Paper 1. These indicators help assess the quality, sustainability, and inclusivity of growth in an economy.
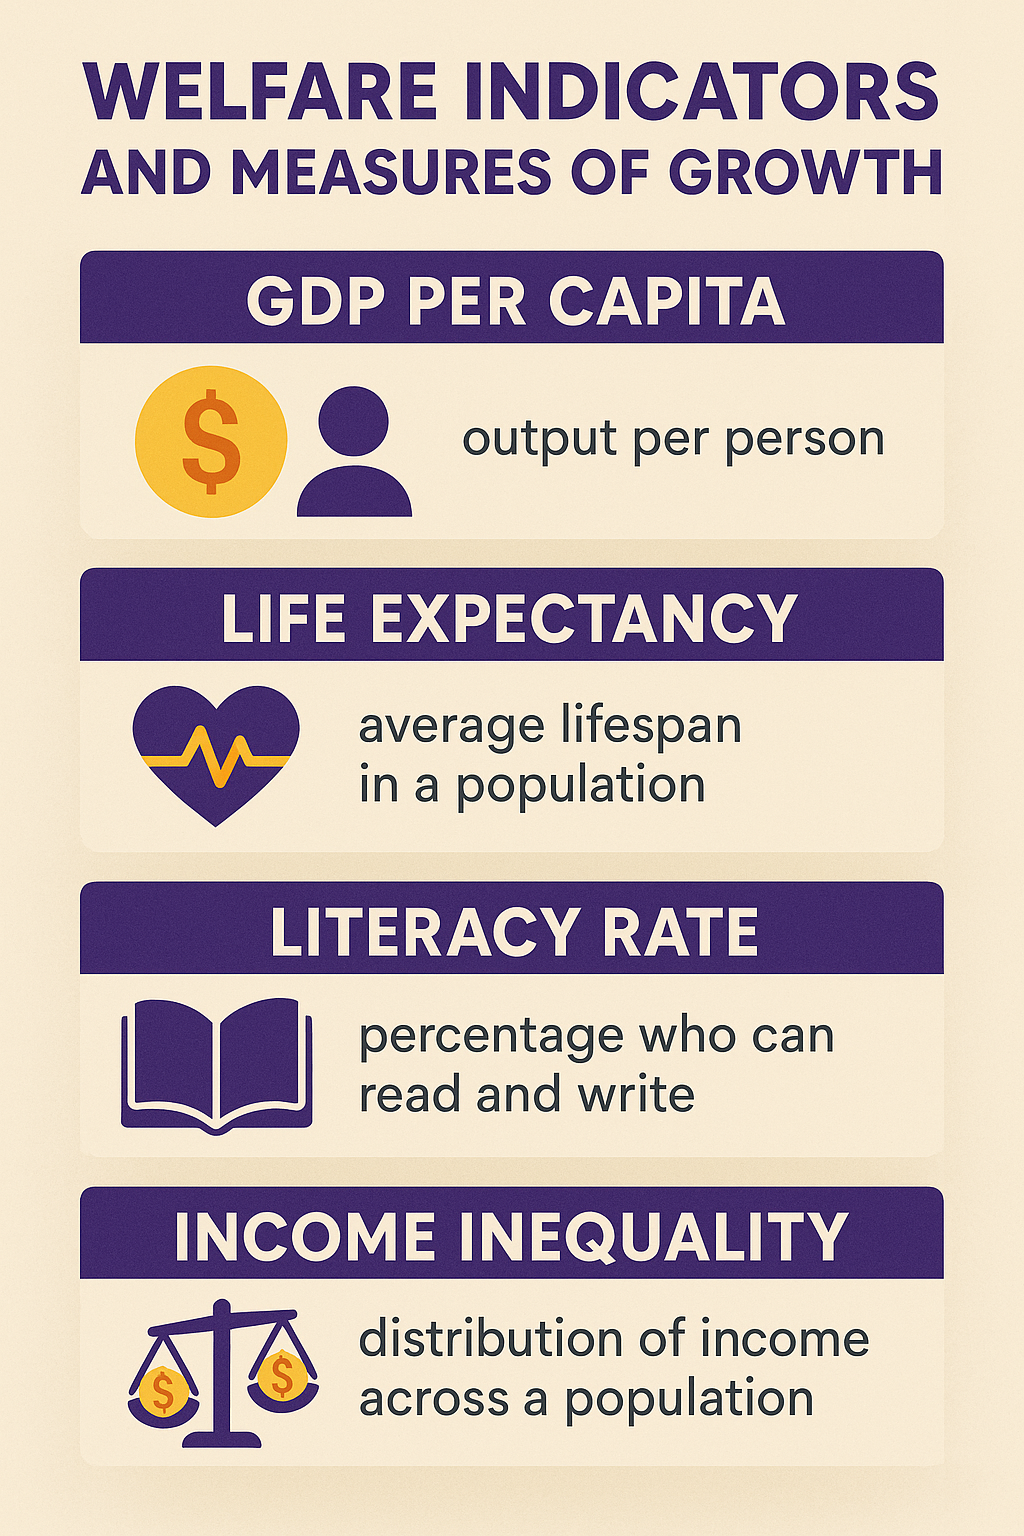
📊 Infographic: Welfare Indicators and Growth Measures
🧠 Mind Map: Welfare and Growth Indicators
1. Introduction
Economic growth is typically measured using indicators like Gross Domestic Product (GDP). However, these fail to reflect the actual well-being of people. Welfare indicators go a step further by capturing social, environmental, and distributional dimensions of development.
2. Traditional Measures of Growth
- GDP (Gross Domestic Product): Total value of goods and services produced within a country.
- GNP (Gross National Product): GDP + Net income from abroad.
- Net Domestic Product (NDP): GDP – Depreciation.
- Per Capita Income: GDP divided by population, used as a proxy for average income.
These indicators, while useful, do not account for inequality, environmental degradation, or quality of life.
3. Composite Welfare Indices
3.1 Human Development Index (HDI)
Developed by UNDP, HDI includes three dimensions:
- Life expectancy at birth
- Education (mean years and expected years of schooling)
- Gross National Income per capita
3.2 Gender Development Index (GDI)
Measures gender gaps in HDI components. A lower GDI shows greater disparity.
3.3 Multidimensional Poverty Index (MPI)
Identifies deprivations in health, education, and living standards, offering a more granular view of poverty than income measures alone.
3.4 Human Poverty Index (HPI)
Earlier measure that included probability of not surviving till age 40, adult literacy rate, and access to clean water.
Graduation degree with IAS coaching
4. Sustainability and Inclusive Growth Measures
4.1 Green GDP
Adjusts GDP by subtracting environmental costs like pollution and resource depletion.
4.2 Genuine Progress Indicator (GPI)
Includes income distribution, unpaid work, crime, and environmental costs to better reflect social well-being.
4.3 Inclusive Wealth Index (IWI)
Considers produced capital, human capital, and natural capital to assess sustainability.
5. Social Indicators of Welfare
- Literacy Rate
- Life Expectancy
- Infant Mortality Rate (IMR)
- Access to safe drinking water
- Female labor force participation
6. Modern and Subjective Measures of Welfare
6.1 World Happiness Report
Ranks countries based on subjective well-being using factors such as social support, freedom, corruption perception, and GDP per capita.
6.2 OECD Better Life Index (BLI)
Measures well-being across 11 dimensions including housing, income, jobs, community, education, environment, governance, health, life satisfaction, safety, and work-life balance.
6.3 Well-being Index
Developed by various organizations (e.g., Gallup), it assesses physical, emotional, and economic wellness.
7. Comparison Table of Key Welfare Indicators
| Indicator | Components | Limitations |
|---|---|---|
| GDP | Monetary value of goods/services | No equity, health, or environment consideration |
| HDI | Health, Education, Income | Ignores inequality and environment |
| MPI | Deprivation across 10 indicators | Data-intensive, complex |
| Green GDP | GDP adjusted for ecological loss | Valuation challenges |
| Happiness Index | Subjective well-being metrics | Lacks objectivity |
8. India’s Experience
- India’s GDP growth post-1991 reforms has not translated evenly into HDI improvement.
- Ranked 134 in HDI 2022 (UNDP Report)
- High inequality, child malnutrition, and education disparities persist.
- NITI Aayog publishes SDG Index to monitor welfare-oriented targets.
9. Welfare Indicators in Policy-Making
- Used to allocate funds (Finance Commission, SDG targets)
- Influence poverty line debates (Tendulkar vs Rangarajan Committee)
- Determine regional and gender-based planning priorities
- Help track outcomes under government schemes like MGNREGA, Ayushman Bharat, Beti Bachao
📚 Previous Year UPSC Questions (PYQs)
- Critically examine the limitations of GDP as a measure of development. (2018)
- Discuss the significance of Human Development Index in evaluating economic growth. (2020)
- Differentiate between Green GDP and traditional GDP. How does it reflect sustainability? (2019)
🔮 Probable Questions for Upcoming UPSC Prelims & Mains
- Discuss the merits and demerits of using subjective indices like Happiness Index in policy-making.
- Explain the role of composite welfare indices in achieving sustainable development goals.
- Do welfare indicators provide a better picture of national development than economic indicators?
- What lessons can India learn from global experience in measuring well-being?
best economics optional test series
best teacher of economics optional
Best economics optional coaching

No Comments