


16 Jul PAIMANA Dashboard: Monitoring India’s Infrastructure Performance
Subject Relevance — Where This Topic Fits
- GS Paper III — Indian Economy and issues relating to Planning, Mobilization of Resources, Growth, Development and Employment | GS Paper III — Infrastructure: Energy, Ports, Roads, Airports, Railways etc. | GS Paper II — Government Policies and Interventions for Development in various sectors and issues arising out of their Design and Implementation
- Prelims: PAIMANA Dashboard, MoSPI, Infrastructure Performance Indicators, Evidence-based Policy Making, National Infrastructure Pipeline, Gati Shakti, Digital Infrastructure, Multimodal Connectivity, Logistics Efficiency, Data Governance
- Essay: Infrastructure as the bedrock of economic growth and social development., Data-driven governance: The future of public policy and service delivery.
Quick Revision: The PAIMANA Performance Dashboard by MoSPI is a crucial digital initiative for transparent, evidence-based monitoring of India’s key infrastructure sectors across five dimensions, driving informed policy and efficient resource allocation.
Why is this in the news?
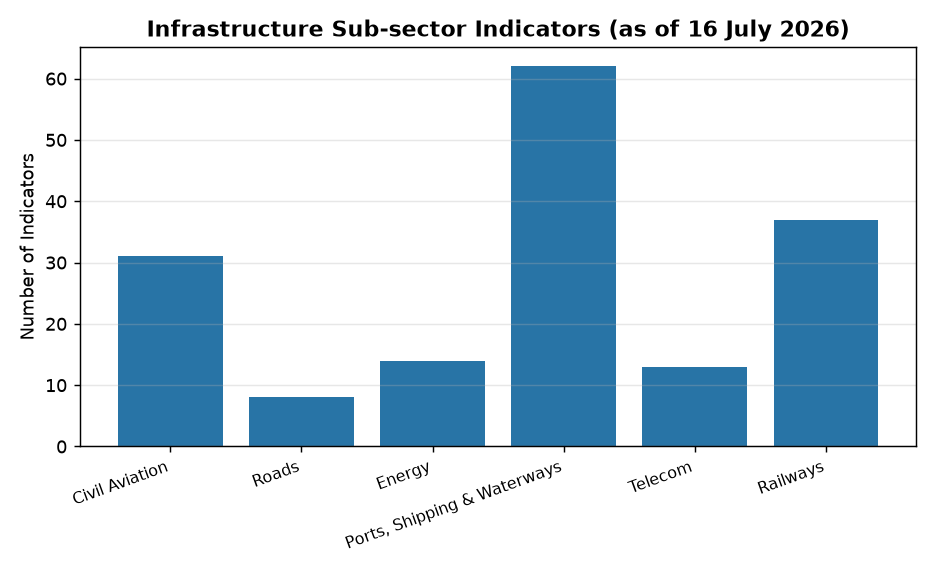
The Ministry of Statistics and Programme Implementation (MoSPI) recently released the quarterly update of the Project Appraisal, Infrastructure Monitoring and Analysis (PAIMANA) Performance Dashboard. This update, dated July 16, 2026, incorporates the latest data for 165 performance indicators across key infrastructure sectors, including 44 newly added indicators, aiming to enhance evidence-based monitoring and informed decision-making for infrastructure development in India.
Background
- Infrastructure development is a critical enabler for India’s economic growth, job creation, and improved quality of life.
- Historically, monitoring of infrastructure projects and sectoral performance has faced challenges related to data availability, standardization, and real-time insights.
- The need for a robust, integrated, and transparent mechanism for infrastructure performance monitoring led to the conceptualization of the PAIMANA dashboard.
- The dashboard was officially launched on April 16, 2026, to provide a comprehensive overview of key infrastructure sub-sectors and strengthen evidence-based policy formulation.
- Regular updates, such as the latest quarterly release, are crucial for maintaining the dashboard’s relevance and utility for policymakers, researchers, and the public.
- The initiative aligns with the government’s broader vision of ‘Minimum Government, Maximum Governance’ and leveraging technology for enhanced public service delivery and transparency.
What is the PAIMANA Performance Dashboard?
- PAIMANA, an acronym for Project Appraisal, Infrastructure Monitoring and Analysis, is a performance dashboard launched by the Ministry of Statistics and Programme Implementation (MoSPI).
- It serves as an integrated digital interface designed for monitoring the performance of major infrastructure sectors in India.
- The dashboard was launched on April 16, 2026, with the primary objective of strengthening infrastructure monitoring and facilitating evidence-based policy formulation.
- It utilizes a standardized framework based on five key dimensions: Accessibility, Quality, Fiscal Cost & Revenue, Utilization, and Affordability.
- The latest update has expanded the dashboard to include 165 indicators, with 44 new additions, providing a more comprehensive view of infrastructure performance.
- It aggregates and disseminates the latest data received from concerned ministries/departments, ensuring timely access to official infrastructure performance statistics.
- The platform offers interactive visualizations and time-series analysis for sector-wise performance, making data interpretation and understanding easier for stakeholders.
- PAIMANA aims to enhance transparency by providing a single, publicly accessible platform for the latest infrastructure performance figures.
Key Features
| Feature | Significance |
|---|---|
| Comprehensive Coverage | Monitors performance across key infrastructure sub-sectors like Civil Aviation, Roads, Energy, Ports, Shipping & Waterways, Telecommunications, and Railways. |
| Expanded Indicator Set (165 indicators) | Includes 44 new indicators, significantly enhancing the breadth and depth of infrastructure performance monitoring, capturing more nuanced aspects. |
| Standardized Monitoring Framework | Uses five dimensions (Accessibility, Quality, Fiscal Cost & Revenue, Utilization, Affordability) for consistent and comparable performance evaluation across sectors. |
| Timely Data Dissemination | Ensures prompt release of official infrastructure performance statistics through quarterly updates, crucial for real-time decision-making. |
| Integrated Digital Interface | Provides a single, publicly accessible platform with interactive visualizations and time-series analysis, improving data accessibility and interpretation for all stakeholders. |
| Evidence-Based Policy Support | Offers robust data and insights to policymakers, researchers, and stakeholders, strengthening the foundation for informed policy formulation and strategic planning. |
Why it Matters
Economic Growth and Development
- Provides crucial insights into the health and growth of India’s infrastructure, which is a key driver of economic activity, investment, and job creation.
- Facilitates efficient resource allocation by identifying underperforming sectors or regions, thereby optimizing public and private investments.
- Contributes to improved logistics efficiency and reduced transaction costs across the economy, enhancing India’s competitiveness.
Governance and Transparency
- Enhances transparency and accountability in infrastructure project implementation and sectoral performance by making official data publicly available.
- Empowers citizens, researchers, and civil society organizations with data to scrutinize government performance and contribute to policy discourse.
- Strengthens data governance by standardizing indicators and ensuring timely, reliable data collection and dissemination from various ministries.
Policy Formulation and Decision Making
- Enables evidence-based policy making by providing granular, real-time data on infrastructure performance, allowing for targeted interventions and adjustments.
- Supports strategic planning and long-term visioning for infrastructure development, aligning with national goals like ‘Viksit Bharat 2047’.
- Facilitates inter-ministerial coordination and synergy by offering a common platform for monitoring and evaluating progress across diverse infrastructure sub-sectors.
Sectoral Performance and Efficiency
- Highlights key trends and performance in specific sectors, such as the 11.8% growth in civil aviation freight, 24.7% increase in wireless data consumption, and 9,360 km of national highway construction in FY 2025-26.
- Identifies areas of strength and potential for improvement, such as the significant expansion potential in battery energy storage systems (BESS) in the power sector.
- Showcases improvements in operational efficiency, like the record increase in broad gauge wagon carrying capacity in railways, contributing to better freight movement.
Challenges
1. Data Accuracy and Consistency
- Ensuring the accuracy, reliability, and consistency of data reported by various ministries and departments remains a persistent challenge.
- Discrepancies in data collection methodologies or reporting standards across different agencies can impact the dashboard’s overall integrity.
UPSC Link: Data Governance; Inter-Ministerial Coordination
2. Indicator Relevance and Evolution
- While expanded, continuously ensuring that the chosen indicators remain relevant and capture the evolving complexities of infrastructure development is crucial.
- The dynamic nature of technology and infrastructure demands regular review and update of the indicator set to avoid obsolescence.
UPSC Link: Monitoring and Evaluation Frameworks; Policy Adaptability
3. Integration with Ground Realities
- The dashboard provides macro-level performance indicators, but translating these into actionable insights for specific projects or localized issues can be challenging.
- Bridging the gap between high-level data and on-ground project implementation realities requires further analytical tools and field verification.
UPSC Link: Project Management; Implementation Challenges
4. Capacity Building
- Effective utilization of such a sophisticated dashboard requires adequate capacity building among policymakers, analysts, and even the public.
- Training on data interpretation, visualization tools, and leveraging insights for policy formulation is essential.
UPSC Link: Human Resource Development; Digital Literacy
5. Data Security and Privacy
- As more sensitive data is integrated, ensuring robust cybersecurity measures and adherence to data privacy principles becomes paramount.
- Protecting official statistics from unauthorized access or manipulation is critical for maintaining public trust.
UPSC Link: Cybersecurity; Data Protection
Challenges — UPSC Perspective
| Issue | Concern |
|---|---|
| Data Silos & Interoperability | Despite consolidation, underlying data from different ministries might still reside in silos, posing challenges for seamless integration and cross-sectoral analysis. |
| Quality of Data Input | The dashboard’s output quality is directly dependent on the accuracy and timeliness of data inputs from various source agencies, which can vary. |
| User Adoption & Engagement | Ensuring widespread adoption and active engagement by all target stakeholders (policymakers, researchers, public) requires continuous outreach and user-friendly design. |
| Dynamic Policy Environment | Rapid changes in policy priorities or economic conditions might necessitate quick adaptation of monitoring parameters, which can be a logistical challenge. |
| Resource Allocation for Maintenance | Sustaining and continuously upgrading such a sophisticated digital platform requires dedicated financial and human resources over the long term. |
Government Initiatives — Must-Memorise for Prelims
- PM Gati Shakti National Master Plan
- National Infrastructure Pipeline (NIP)
- Bharatmala Pariyojana
- Sagarmala Programme
- UDAN (Ude Desh ka Aam Naagrik)
- National Rail Plan (NRP)
- National Logistics Policy (NLP)
- National Digital Communications Policy (NDCP)
- Revamped Distribution Sector Scheme (RDSS)
- Green Energy Corridors (GEC)
Way Forward
- Further enhance data integration and interoperability across various government platforms and ministries to create a truly unified data ecosystem.
- Regularly review and update the performance indicators to reflect emerging trends, technological advancements, and evolving policy priorities in infrastructure.
- Develop advanced analytical capabilities, including predictive analytics and AI/ML-driven insights, to move beyond descriptive monitoring to proactive policy interventions.
- Strengthen capacity building initiatives for government officials and stakeholders on leveraging the dashboard for effective planning, monitoring, and evaluation.
- Promote greater public engagement and feedback mechanisms to ensure the dashboard remains relevant, accessible, and responsive to user needs.
- Integrate environmental, social, and governance (ESG) metrics into the dashboard to ensure sustainable and inclusive infrastructure development.
- Explore linkages with global best practices in infrastructure monitoring and adopt suitable innovations to enhance the dashboard’s efficacy.
- Focus on disaggregated data analysis to identify regional disparities and tailor infrastructure development strategies for equitable growth.
UPSC Value Addition
Keywords for Mains Answer-Writing
Infrastructure Monitoring · Evidence-Based Policy · Data Governance · Digital Public Infrastructure · Multimodal Connectivity · Logistics Efficiency · Sustainable Infrastructure · Transparency and Accountability · Economic Multiplier Effect · Sectoral Performance Indicators · Viksit Bharat · Project Management
Constitutional & Policy Linkages
- Seventh Schedule (Union List, State List, Concurrent List): Defines legislative powers over various infrastructure sectors.
- Article 282: Union or State may make grants for any public purpose, including infrastructure.
- Article 292 & 293: Borrowing by the Government of India and States for developmental projects.
- Ministry of Statistics and Programme Implementation (MoSPI): Mandate for statistical system and program implementation monitoring.
- National Data Governance Framework Policy: Aims to improve government data access, quality, and use.
Concept Flow
Need for Infrastructure Development → Launch of PAIMANA Dashboard (April 2026) → Collection of Standardized Performance Data → Quarterly Updates & Data Dissemination → Evidence-Based Policy Making → Improved Infrastructure Performance & Economic Growth
Prelims Practice Questions
Q1. With reference to the PAIMANA Performance Dashboard, consider the following statements:
1. It is an initiative of the Ministry of Finance.
2. It monitors infrastructure performance based on five dimensions: Accessibility, Quality, Fiscal Cost & Revenue, Utilization, and Affordability.
3. The latest update has expanded the dashboard to include 165 indicators.
Which of the statements given above is/are correct?
- A. 1 and 2 only
- B. 2 and 3 only
- C. 1 and 3 only
- D. 1, 2 and 3
Answer: B. 2 and 3 only — Statement 1 is incorrect: PAIMANA is an initiative of the Ministry of Statistics and Programme Implementation (MoSPI). Statement 2 is correct: The dashboard uses a standardized framework based on these five dimensions. Statement 3 is correct: The latest quarterly update includes 165 indicators, with 44 new additions.
Q2. Which of the following infrastructure sub-sectors are monitored by the PAIMANA Performance Dashboard, as per the latest update?
1. Civil Aviation
2. Roads
3. Energy
4. Ports, Shipping and Waterways
5. Telecommunications
6. Railways
Select the correct answer using the code given below:
- A. 1, 2, 3 and 4 only
- B. 2, 3, 5 and 6 only
- C. 1, 2, 3, 4, 5 and 6
- D. 1, 3, 4 and 5 only
Answer: C. 1, 2, 3, 4, 5 and 6 — All the listed sub-sectors — Civil Aviation, Roads, Energy, Ports, Shipping and Waterways, Telecommunications, and Railways — are explicitly mentioned as infrastructure sub-sectors whose performance indicators are distributed and monitored by the PAIMANA dashboard.
Mains Practice Question
✍ The PAIMANA Performance Dashboard represents a significant stride towards data-driven governance in India’s infrastructure sector. Discuss the key features and significance of this initiative, highlighting how it can address the challenges in infrastructure project monitoring and policy formulation. (250 words, 15 marks)
Approach: Begin by introducing the PAIMANA Dashboard and its launch by MoSPI. Detail its key features such as the expanded indicator set, standardized monitoring framework, and integrated digital interface. Subsequently, elaborate on its significance for economic growth, governance, transparency, and evidence-based policy making. Conclude by linking how these features and significance directly contribute to overcoming traditional challenges in infrastructure monitoring, such as data silos, lack of real-time insights, and inefficient resource allocation, thereby fostering more effective and accountable infrastructure development.
Source: PIB (Press Information Bureau)
Generated by AanyaAi for educational purpose.

- AI से उत्पादकता बढ़ेगी या घटेगी? जानिए विशेषज्ञों की राय - September 3, 2026
- AI’s Productivity Paradox: Will Automation Boost or Reduce Output? - September 3, 2026
- असम के विकास में केंद्र की भूमिका: विधानसभा अध्यक्ष और डॉ. जितेंद्र सिंह की बैठक - September 3, 2026

No Comments