


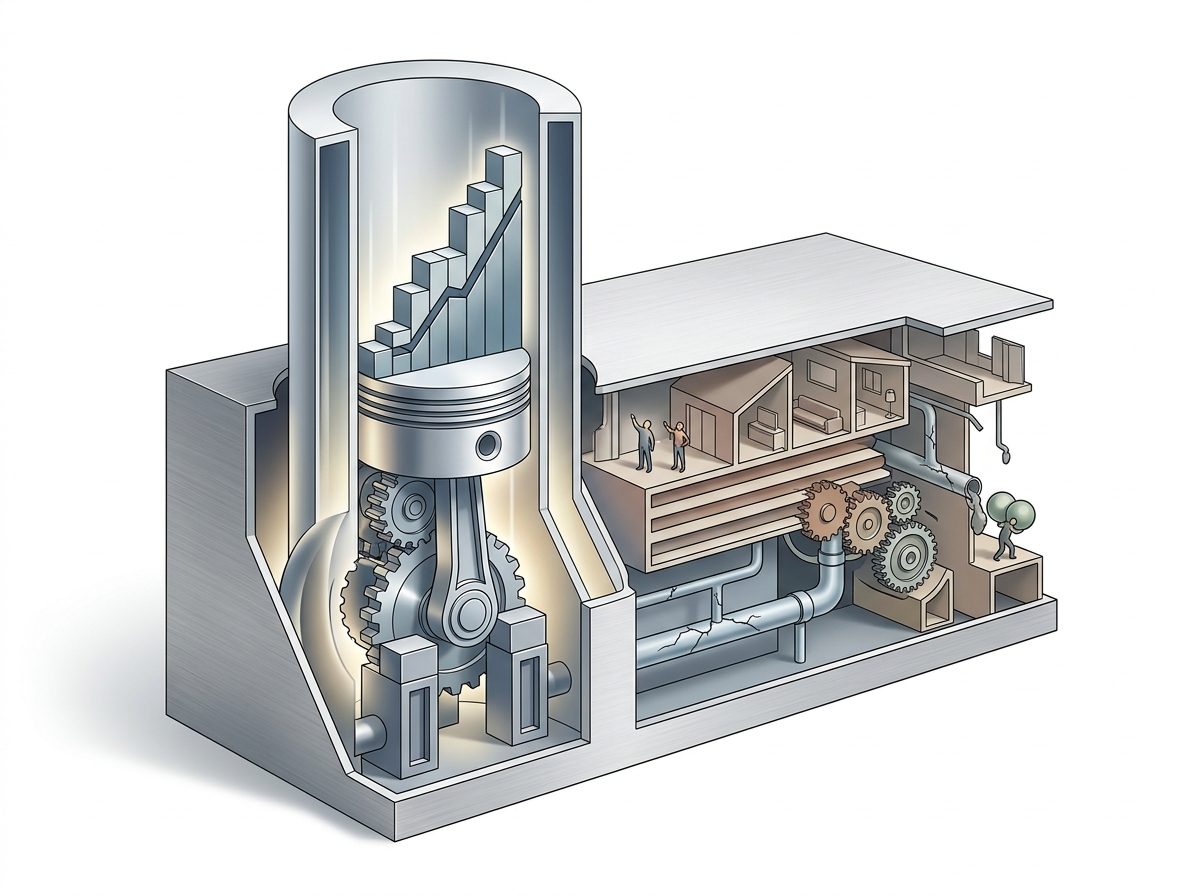
05 Sep GDP Growth at 7.8%: Why Household Relief Lags Behind in 2026-27?
✎ GDP measures production, not prosperity; employment elasticity and informality determine whether growth translates into household welfare.
Subject Relevance — Where This Topic Fits
- GS Paper III — Indian Economy: Issues relating to Planning, Mobilization of Resources, Growth, Development and Employment | GS Paper III — Inclusive Growth and Associated Challenges | GS Paper III — Government Budgeting
- Prelims: GDP vs GVA, Nominal vs Real GDP, Base Year Revision (2022-23), Periodic Labour Force Survey (PLFS), Double Deflation, Labour Force Participation Rate, Unemployment Rate, Youth Unemployment, Informal Sector Employment
- Essay: Economic Growth vs Inclusive Development: The Paradox of High GDP and Persistent Livelihood Insecurity, Measuring Progress Beyond GDP: The Imperative of Employment, Wages, and Social Security
Quick Revision: GDP measures production, not prosperity; employment elasticity and informality determine whether growth translates into household welfare.
Why is this in the news?
The Ministry of Statistics and Programme Implementation (MoSPI) reported a robust 7.8% real GDP growth for Q1 FY27 (April–June 2026), accompanied by a 10.3% nominal GDP expansion and an 8.2% rise in real GVA. While these figures underscore economic resilience, they contrast sharply with lingering concerns over employment generation, wage stagnation, and inadequate household relief. This juxtaposition has reignited debates on the adequacy of GDP as a sole metric of economic well-being, the methodological robustness of the new GDP series (base year 2022-23), and the efficacy of policy instruments in translating growth into tangible household welfare.
Background
- The Indian economy has transitioned to a new GDP series with 2022-23 as the base year, incorporating methodological advancements such as double deflation in manufacturing and enhanced administrative data integration to improve accuracy and coverage.
- The PLFS, conducted by the National Statistical Office (NSO), is India’s primary source for labour market statistics, including unemployment rates, labour force participation rates, and employment distribution by sector and demographic groups.
- The unemployment rate, while a critical indicator, measures the proportion of the labour force without work but actively seeking employment, thereby excluding discouraged workers and those in vulnerable employment who may lack adequate livelihoods despite being technically employed.
- The new GDP series (2022-23 base) reflects structural shifts in the economy, including the rise of digital, financial, and technology-driven sectors, which contribute disproportionately to value addition with lower employment elasticities compared to traditional labour-intensive industries.
- Policy discourse in India has increasingly emphasised inclusive growth, with initiatives such as the Mahatma Gandhi National Rural Employment Guarantee Scheme (MGNREGS), Pradhan Mantri Kisan Samman Nidhi (PM-KISAN), and the Code on Social Security (2020) aimed at addressing livelihood vulnerabilities, though their impact on aggregate employment remains debated.
Understanding GDP Growth, Employment Metrics, and the Distributional Challenge
- GDP (Gross Domestic Product) measures the total monetary value of goods and services produced within a country’s borders over a specific period, serving as a key indicator of economic activity and growth. Real GDP adjusts for inflation, providing a more accurate reflection of actual output changes over time.
- GVA (Gross Value Added) measures the value of goods and services produced in an economy, excluding taxes and subsidies, and is often used to assess sectoral contributions to growth. The new GDP series (2022-23 base) incorporates double deflation—a method that separately deflates inputs and outputs to avoid overestimating value addition in sectors with volatile input costs, such as manufacturing.
- Unemployment rate, as defined by the International Labour Organization (ILO), is the percentage of the labour force (individuals willing and available to work) who are without work but actively seeking employment. It does not account for underemployment, informal sector workers, or those in vulnerable employment who may lack job security or adequate income.
- Labour Force Participation Rate (LFPR) measures the proportion of working-age individuals (15 years and above) who are either employed or actively seeking work. A declining LFPR may indicate discouraged workers exiting the labour force due to prolonged unemployment or lack of job opportunities.
- Employment elasticity refers to the responsiveness of employment growth to GDP growth. Sectors with low employment elasticity (e.g., technology, financial services) can drive GDP growth without proportionately increasing jobs, exacerbating the decoupling between growth and employment.
- The informal sector, which employs over 80% of India’s workforce, is characterised by low productivity, lack of social security, and precarious working conditions. Its dominance complicates the translation of GDP growth into improved livelihoods for a majority of workers.
- Policy instruments such as MGNREGS, PM-KISAN, and the Code on Social Security (2020) aim to mitigate livelihood vulnerabilities but face implementation challenges, including fund allocation, coverage gaps, and administrative bottlenecks, limiting their impact on aggregate employment and household welfare.
Key Features
| Feature | Significance |
|---|---|
| Real GDP Growth (7.8% Q1 FY2026-27) | Indicates robust economic expansion, reflecting heightened production, investment, and consumption levels during April-June 2026. |
| Nominal GDP Growth (10.3%) | Demonstrates increased economic activity in current prices, influenced by inflation and higher output across sectors. |
| Gross Value Added (GVA) Growth (8.2%) | Measures net output after intermediate consumption, providing a sectoral view of economic performance. |
| Investment Growth (11.9%) | Signals strong capital formation, potentially enhancing future productive capacity and employment generation. |
| Unemployment Rate (3.1% in PLFS 2025) | Official measure of joblessness as a proportion of the labour force, though insufficient to capture underemployment or informal sector challenges. |
Why it Matters
Macroeconomic Resilience
- The GDP growth of 7.8% in Q1 FY2026-27 underscores India’s economic resilience amid global uncertainties, aligning with long-term growth trajectories.
- High investment growth (11.9%) suggests sustained capital accumulation, critical for infrastructure development and industrial expansion.
- Robust export growth (12%) reflects improved competitiveness in global markets, potentially reducing trade deficits and boosting foreign exchange reserves.
Sectoral Performance
- GVA growth (8.2%) indicates broad-based economic expansion, with manufacturing and services likely contributing significantly due to methodological updates in the new GDP series (base year 2022-23).
- Domestic consumption growth (7.1%) reflects rising demand, though its sustainability depends on income distribution and purchasing power parity.
Labour Market Dynamics
- Declining unemployment rates (3.1% in 2025) suggest incremental improvements in job creation, particularly among youth (9.9% unemployment rate).
- Urban youth unemployment (13.6%) highlights spatial and demographic disparities, necessitating targeted skilling and urban employment policies.
- Educated unemployment (6.5%) indicates a mismatch between labour market demands and educational outcomes, warranting reforms in higher education and vocational training.
Methodological Context
- The new GDP series (2022-23 base year) incorporates administrative data and double deflation in manufacturing, improving accuracy but complicating historical comparisons.
- Critiques by former RBI Governor Raghuram Rajan and former Finance Secretary Subhash Chandra Garg highlight the need for transparent methodological justifications to maintain credibility.
Challenges
1. DISCREPANCY BETWEEN GDP GROWTH AND HOUSEHOLD WELL-BEING
- GDP measures aggregate production, not equitable distribution; rapid growth may coexist with stagnant wages, underemployment, or informal sector vulnerabilities.
- Automation and digitalisation can drive GDP growth without proportionate job creation, exacerbating structural unemployment.
- Purchasing power and economic dignity remain unaddressed by GDP metrics, necessitating complementary indicators like the Multidimensional Poverty Index (MPI).
UPSC Link: GS-III: Inclusive growth and issues arising from it
2. STRUCTURAL UNEMPLOYMENT INFORMAL SECTOR
- Official unemployment rates understate underemployment and informal sector precarity, where workers lack social security and stable incomes.
- Migrant labourers and daily-wage earners face cyclical unemployment, particularly in sectors like construction and agriculture, which are not fully captured by PLFS.
- Policy interventions must prioritise formalisation of the informal sector and universal social security coverage.
UPSC Link: GS-III: Indian economy and issues relating to employment
3. METHODOLOGICAL TRANSPARENCY IN GDP CALCULATIONS
- Frequent revisions in GDP methodology (e.g., 2015, 2022-23) raise questions about data consistency and comparability over time.
- Lack of granular sectoral data in public domain limits independent verification and policy formulation.
- Need for an autonomous statistical commission to oversee methodological changes and ensure public trust.
UPSC Link: GS-III: Indian economy and issues relating to planning, resource mobilisation
4. REGIONAL AND DEMOGRAPHIC DISPARITIES
- Urban youth unemployment (13.6%) exceeds rural rates, highlighting migration pressures and skill gaps in metropolitan labour markets.
- Educated unemployment (6.5%) suggests misalignment between higher education outputs and industry requirements, necessitating curriculum reforms.
- Regional disparities in growth (e.g., states with lower investment inflows) exacerbate inter-state inequality, requiring targeted fiscal federalism.
UPSC Link: GS-II: Issues relating to development and management of Social Sector/Services
5. FISCAL POLICY ALIGNMENT WITH GROWTH
- Rapid GDP growth does not automatically translate to higher tax revenues or fiscal space for redistribution, particularly if growth is capital-intensive.
- Weak household relief mechanisms (e.g., limited direct benefit transfers or wage subsidies) indicate gaps in translating growth into welfare.
- Need for progressive taxation and targeted subsidies to ensure inclusive growth.
UPSC Link: GS-III: Indian economy and issues relating to mobilisation of resources
Challenges — UPSC Perspective
| Issue | Concern |
|---|---|
| GDP vs. Employment Divergence | Rapid GDP growth may not correlate with job creation, particularly in capital-intensive or automated sectors. |
| Informal Sector Vulnerabilities | Lack of formal employment contracts, social security, and wage stability undermines household economic security. |
| Urban Youth Unemployment | High rates (13.6%) reflect skill mismatches and structural barriers in metropolitan labour markets. |
| Educated Unemployment | 6.5% unemployment among educated youth indicates systemic failures in higher education and vocational training alignment. |
| Methodological Opacity in GDP | Frequent revisions and lack of granular data hinder independent analysis and policy formulation. |
| Regional Inequality | Disparities in investment and growth across states exacerbate inter-state economic divergence. |
Way Forward
- Enhance transparency in GDP calculation methodologies by publishing detailed sectoral and methodological notes for public scrutiny.
- Expand the coverage of the Periodic Labour Force Survey (PLFS) to include underemployment, informal sector workers, and gig economy participants.
- Implement targeted skilling and vocational training programmes aligned with industry demands, particularly for urban youth and educated unemployed.
- Strengthen social security nets for informal sector workers through universal coverage of schemes like PM-SYM (Pradhan Mantri Shram Yogi Maan-dhan) and ESIC.
- Introduce progressive taxation reforms to generate fiscal space for redistributive policies, including direct benefit transfers and wage subsidies.
- Promote formalisation of the informal sector through simplified compliance regimes, digital payments adoption, and access to credit.
- Establish an autonomous statistical commission to oversee methodological changes in GDP and other economic indicators, ensuring data integrity.
- Develop regional growth strategies to address inter-state disparities, leveraging fiscal federalism and targeted infrastructure investments.
UPSC Value Addition
Keywords for Mains Answer-Writing
Gross Domestic Product (GDP) measurement · Gross Value Added (GVA) · Periodic Labour Force Survey (PLFS) · Unemployment rate · Youth unemployment · Economic growth vs employment generation · National Statistical Office (NSO) · Ministry of Statistics and Programme Implementation (MoSPI) · Base year revision in GDP estimation · Double deflation method · Informal sector employment · Economic distress and purchasing power · Labour market dynamics · Economic resilience and inclusive growth
Concept Flow
High GDP growth (7.8% Q1 FY2026-27) → Aggregate production increases → Investment (11.9%) and exports (12%) rise → Sectoral GVA (8.2%) and domestic consumption (7.1%) expand. → GDP growth driven by capital-intensive sectors → Limited job creation → Unemployment rates decline marginally (3.1%) but underemployment persists. → Urban youth unemployment (13.6%) and educated unemployment (6.5%) → Skill mismatches and structural barriers → Informal sector vulnerabilities intensify. → Methodological updates in GDP series (2022-23 base year) → Improved accuracy but reduced historical comparability → Need for transparent data dissemination. → Rapid growth without equitable distribution → Household relief mechanisms remain weak → Purchasing power and economic dignity unaddressed. → Policy response required: Skilling programmes, social security expansion, and fiscal reforms to align growth with inclusive development.
Prelims Practice Questions
Q1. Consider the following statements regarding the Gross Domestic Product (GDP) and Gross Value Added (GVA) in India:
1. GDP measures the total value of goods and services produced within the domestic territory of a country.
2. GVA measures the value of output minus the value of intermediate consumption.
3. The base year for GDP calculation in India was revised from 2011–12 to 2022–23 in 2026.
4. Double deflation is a method used to separate the impact of price changes on output and intermediate consumption.
How many of the above statements are correct?
- Only one
- Only two
- Only three
- All
Answer: All — Statements 1, 2, and 4 are correct. Statement 3 is incorrect as the base year was revised in 2020–21, not 2026.
Q2. Assertion (A): The Periodic Labour Force Survey (PLFS) reports unemployment rates based on the labour force participation rate.
Reason (R): The labour force participation rate includes only those who are employed or actively seeking employment.
- Both A and R are true, and R is the correct explanation of A.
- Both A and R are true, but R is not the correct explanation of A.
- A is true, but R is false.
- A is false, but R is true.
Answer: Both A and R are true, but R is not the correct explanation of A. — The unemployment rate is calculated as the ratio of unemployed persons to the labour force, which includes both employed and unemployed individuals actively seeking work. Thus, R correctly explains A.
Q3. Match the following terms related to economic measurement with their correct descriptions:
Column I
A. Nominal GDP
B. Real GDP
C. GVA at basic prices
D. Double deflation
Column II
1. GDP measured at current market prices, not adjusted for inflation
2. GDP adjusted for inflation using a base year price level
3. Value of output minus the value of intermediate consumption, excluding taxes on products
4. Method used to separate the impact of price changes on output and intermediate consumption
- A-1, B-2, C-3, D-4
- A-2, B-1, C-4, D-3
- A-3, B-4, C-1, D-2
- A-4, B-3, C-2, D-1
Answer: A-1, B-2, C-3, D-4 — Nominal GDP (A) is measured at current market prices (1). Real GDP (B) is adjusted for inflation (2). GVA at basic prices (C) excludes taxes on products (3). Double deflation (D) separates price impacts on output and intermediate consumption (4).
Mains Practice Question
✍ ‘GDP growth is not synonymous with employment generation or economic welfare.’ Critically examine this statement with reference to India’s recent economic performance and the Periodic Labour Force Survey (PLFS) data. Also, discuss the implications for policy formulation aimed at inclusive growth. (15 Marks)
Approach: Introduction: Define GDP and its limitations as a welfare measure; introduce PLFS and its role in assessing labour market outcomes. Section 1: Recent GDP growth trends (7.8% in Q1 2026–27) and components (investment, consumption, exports) to establish the context. Section 2: PLFS 2025 data — overall unemployment (3.1%), youth unemployment (9.9%), urban youth unemployment (13.6%), and educated unemployment (6.5%). Highlight the gap between growth and employment. Section 3: Reasons for divergence — automation, digital economy, informal sector dynamics, and methodological issues (base year revision, double deflation). Reference critiques by Raghuram Rajan and Subhash Chandra Garg. Section 4: Policy implications — need for labour-intensive growth, skilling, formalisation of the economy, social security expansion, and targeted welfare measures. Conclusion: Reiterate that GDP alone is insufficient; inclusive growth requires employment-centric policies and multi-dimensional indicators.
Source: orissapost.com
Generated by AanyaAi for educational purpose.
Related guides on our sites
- Best economics services coaching
- Best economics optional coaching
- Best economics optional coaching for upsc
- best teacher of economics optional

- पंजाब में लेक्चरर भर्ती: अनुसूचित जाति आरक्षण पर एनसीएससी ने उठाया सवाल - September 5, 2026
- NCSC Slams Punjab Over SC Reservation Denial in Lecturer Recruitment - September 5, 2026
- कर्नाटक उच्च न्यायालय ने कावेरी 2.0 पोर्टल की तकनीकी खामियां दूर करने का दिया आदेश - September 5, 2026

No Comments