


17 Oct Real-Time Air Pollution Dashboard: India’s Largest Monitoring Centre Explained
✎ The Integrated Command and Control Centre (ICCC) for air quality monitoring in Delhi exemplifies a data-driven governance approach, combining real-time multi-source data with AI analytics to enable timely and targeted…
Subject Relevance — Where This Topic Fits
- GS Paper III — Environment, Ecology, Biodiversity and Climate Change | GS Paper III — Science and Technology — Developments and their Applications and Effects in Everyday Life
- Prelims: Air Quality Index (AQI), Particulate Matter (PM10, PM2.5), National Clean Air Programme (NCAP), Delhi Pollution Control Committee (DPCC), Integrated Command and Control Centre (ICCC), Meteorological dispersion of pollutants, Permissible limits for pollutants under NAAQS
- Essay: Environmental governance and real-time data-driven decision-making, Sustainable urban development and public health infrastructure
Quick Revision: The Integrated Command and Control Centre (ICCC) for air quality monitoring in Delhi exemplifies a data-driven governance approach, combining real-time multi-source data with AI analytics to enable timely and targeted interventions during pollution episodes.
Why is this in the news?
The establishment of the Delhi Pollution Control Committee’s (DPCC) AI-enabled Integrated Command and Control Centre (ICCC) at Shastri Park, Northeast Delhi, marks a significant advancement in real-time air quality monitoring and pollution source identification. The facility, inaugurated on October 1, 2026, integrates multi-source data to track pollutant concentrations, meteorological conditions, and local emission sources, enabling timely interventions during pollution spikes. Its operationalisation coincides with the onset of Delhi’s winter air pollution season, highlighting the urgency of such governance mechanisms in mitigating urban air quality crises.
Background
- Urban air pollution in India, particularly in metropolitan cities like Delhi, is a critical public health and environmental challenge, exacerbated by vehicular emissions, industrial activity, construction dust, and meteorological factors.
- The National Clean Air Programme (NCAP), launched in 2019, aims to reduce particulate matter (PM10 and PM2.5) concentrations by 20-30% by 2024 across 122 non-attainment cities, including Delhi.
- The Air Quality Index (AQI) is a standardised tool for communicating air pollution levels to the public, categorising air quality from ‘Good’ (0-50) to ‘Severe’ (401-500) based on pollutant concentrations.
- The Delhi Pollution Control Committee (DPCC) is the statutory body responsible for enforcing environmental regulations and monitoring air quality in Delhi under the Water (Prevention and Control of Pollution) Act, 1974, and the Air (Prevention and Control of Pollution) Act, 1981.
- Meteorological conditions, such as wind speed, temperature inversions, and humidity, significantly influence the dispersion or accumulation of pollutants, necessitating real-time data integration for effective pollution management.
- The concept of Integrated Command and Control Centres (ICCCs) is derived from urban governance models that utilise data analytics, AI, and multi-agency coordination to address complex urban challenges, including traffic management, disaster response, and environmental monitoring.
What is an Integrated Command and Control Centre (ICCC) for Air Quality Monitoring?
- An ICCC is a centralised real-time monitoring hub that integrates data from multiple sources—air quality monitoring stations, meteorological sensors, satellite imagery, and field reports—to assess pollution levels and identify emission sources.
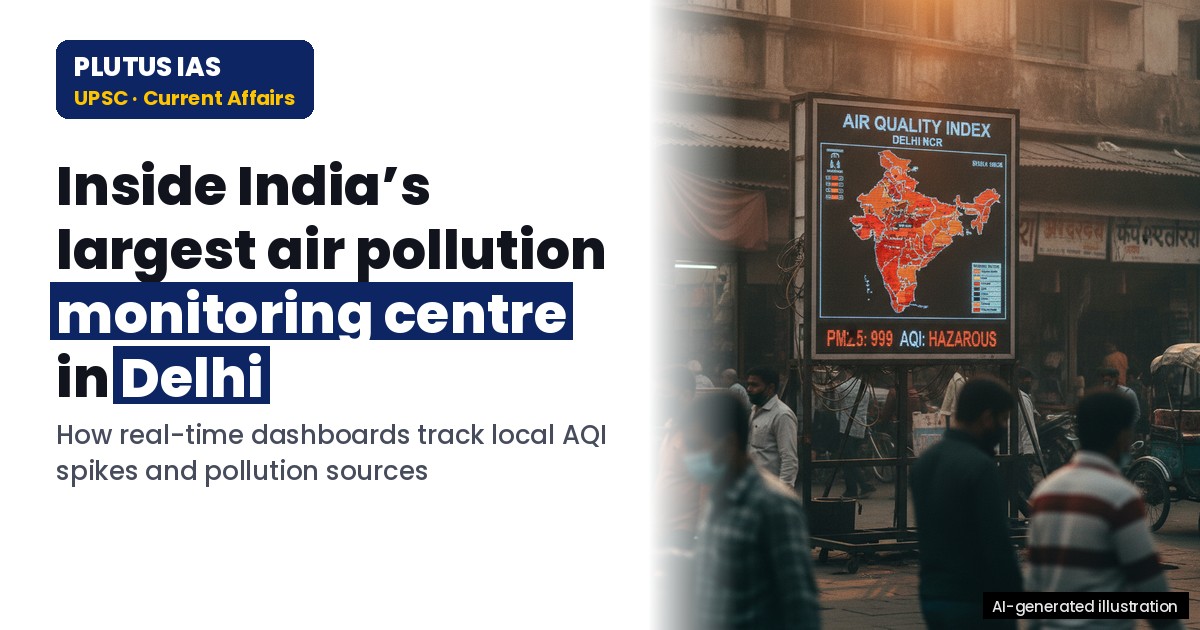
- The ICCC at Shastri Park, Delhi, is equipped with a floor-to-ceiling monitor displaying live AQI data, pollutant concentration maps, wind vectors, and automated alerts for pollution spikes or equipment failures.
- The centre operates 24/7 with multiple shifts, ensuring continuous monitoring and rapid response to pollution events, with daytime operations forming the basis for key governance actions.
- AI and machine learning algorithms analyse historical and real-time data to predict pollution trends, assess the impact of meteorological conditions, and prioritise interventions such as traffic restrictions, construction site inspections, or industrial emission controls.
- The ICCC enables granular localisation of pollution sources, such as identifying specific industrial clusters, construction sites, or road networks contributing to elevated PM10 or PM2.5 levels.
- The integration of IoT-enabled sensors, drones, and field inspections enhances the accuracy of pollution source attribution, reducing reliance on static monitoring stations alone.
- The ICCC serves as a model for other Indian cities, aligning with the NCAP’s objective of establishing similar centres in non-attainment cities to strengthen air quality governance.
Key Features
| Feature | Significance |
|---|---|
| Real-time dashboard with AI integration | Enables instantaneous monitoring of air quality indices (AQI) across multiple locations, facilitating prompt identification of pollution spikes and localized sources. |
| Multi-source data integration | Combines inputs from fixed monitoring stations, meteorological data, construction/industrial activity reports, and field inspections to provide a comprehensive pollution assessment. |
| 24×7 operational shifts | Ensures continuous surveillance with overlapping shifts (10 am–6 pm, 7 am–3 pm, 3 pm–11 pm, 11 pm–7 am), enabling round-the-clock response to pollution events. |
| Automated alerts and warnings | Triggers real-time alerts for deviations in pollutant levels (e.g., PM10/PM2.5 thresholds) and atmospheric conditions (e.g., poor dispersion), aiding proactive mitigation. |
| Historical trend analysis | Leverages past pollution data to identify recurring patterns, unusual spikes, and seasonal variations, supporting long-term policy formulation. |
Why it Matters
Environmental Governance
- Demonstrates a data-driven approach to urban air quality management, aligning with the National Clean Air Programme (NCAP) objectives of reducing particulate matter concentrations by 20–30% by 2024.
- Provides a scalable model for other Indian cities to adopt integrated pollution monitoring systems, enhancing inter-agency coordination.
- Supports evidence-based policymaking by correlating pollution sources (e.g., construction, industry) with real-time AQI data.
Public Health
- Enables timely dissemination of health advisories by linking AQI spikes to vulnerable populations (e.g., children, elderly, respiratory patients).
- Facilitates targeted interventions (e.g., traffic restrictions, industrial shutdowns) during high-pollution episodes to mitigate health risks.
Technological Advancement
- Illustrates the integration of AI and IoT in environmental monitoring, reducing reliance on manual data collection and improving accuracy.
- Highlights the role of geospatial mapping in tracking pollution dispersion and identifying hotspots for remediation.
Institutional Capacity
- Strengthens the institutional framework of the Delhi Pollution Control Committee (DPCC) by centralizing data analysis and decision-making.
- Enhances inter-departmental collaboration (e.g., with meteorological departments, municipal corporations) for holistic pollution control.
Challenges
1. Data Accuracy and Coverage Gaps
- Risk of sensor malfunctions or offline monitoring stations (e.g., Narela station failure) leading to incomplete data and delayed responses.
- Limited spatial coverage of monitoring stations in peri-urban and rural areas of Delhi, potentially underrepresenting pollution sources.
UPSC Link: Environmental Pollution (Prevention & Control) Act, 1986
2. Meteorological Dependence
- Poor atmospheric dispersion (e.g., low wind speed) exacerbates local pollution accumulation, complicating mitigation efforts even with real-time data.
- Seasonal variations (e.g., winter inversions) require adaptive strategies, as dispersion conditions worsen during specific periods.
UPSC Link: Air Quality Index (AQI) Guidelines
3. Operational and Logistical Constraints
- High operational costs of maintaining 24×7 shifts, AI systems, and field inspections, particularly for municipal bodies with limited budgets.
- Coordination challenges among multiple agencies (e.g., DPCC, municipal corporations, traffic police) to implement real-time interventions.
UPSC Link: 74th Constitutional Amendment Act (Urban Local Bodies)
4. Enforcement and Compliance
- Difficulty in pinpointing transient pollution sources (e.g., construction dust, vehicular emissions) despite real-time tracking, leading to enforcement gaps.
- Resistance from industries/construction firms to adopt cleaner technologies or alter operations due to cost or logistical barriers.
UPSC Link: National Green Tribunal (NGT) Jurisdiction
5. Public Awareness and Behavioral Change
- Limited public engagement in pollution mitigation efforts, despite real-time data availability, due to lack of awareness or apathy.
- Challenges in translating AQI advisories into behavioral changes (e.g., reducing vehicle use, avoiding outdoor activities during high pollution).
UPSC Link: Environmental Impact Assessment (EIA) Notifications
Challenges — UPSC Perspective
| Issue | Concern |
|---|---|
| Sensor reliability | Malfunctions or offline stations disrupt real-time monitoring, delaying corrective actions. |
| Meteorological unpredictability | Adverse weather conditions (e.g., stagnant air) can overwhelm mitigation efforts despite accurate data. |
| Inter-agency coordination | Fragmented responsibilities among DPCC, municipal bodies, and traffic authorities hinder swift enforcement. |
| Cost of operations | Sustaining 24×7 shifts, AI systems, and field inspections requires substantial fiscal resources. |
| Public compliance | Low adherence to pollution advisories limits the effectiveness of real-time interventions. |
Way Forward
- Expand the network of air quality monitoring stations to cover peri-urban and underserved areas of Delhi, ensuring comprehensive data coverage.
- Integrate IoT-enabled devices (e.g., low-cost sensors) in residential and industrial zones to supplement fixed stations and improve granularity.
- Develop automated alert systems for vulnerable populations (e.g., SMS/email notifications during AQI spikes) to enhance public health responses.
- Strengthen inter-departmental protocols for real-time interventions (e.g., construction site inspections, traffic diversions) based on dashboard alerts.
- Invest in AI-driven predictive modeling to forecast pollution episodes 48–72 hours in advance, enabling preemptive measures.
- Launch targeted awareness campaigns to educate citizens on the significance of AQI readings and behavioral changes during high-pollution periods.
- Collaborate with research institutions to validate and refine the AI algorithms used in the ICCC, ensuring accuracy and adaptability.
- Establish a dedicated fund for maintenance and upgrades of the monitoring infrastructure, ensuring long-term sustainability.
UPSC Value Addition
Keywords for Mains Answer-Writing
Air Quality Index (AQI) · Particulate Matter (PM10, PM2.5) · Integrated Command and Control Centre (ICCC) · Delhi Pollution Control Committee (DPCC) · real-time air quality monitoring · meteorological data in pollution assessment · urban air pollution management · National Ambient Air Quality Standards (NAAQS) · source apportionment of air pollution · winter air pollution in Delhi · atmospheric dispersion of pollutants · action-taken reports for pollution control · multi-source data integration in environmental governance · constitutional framework for environmental protection · pollution monitoring and enforcement mechanisms
Concept Flow
Urbanization and industrialization → Increased anthropogenic emissions (PM10, PM2.5) → Real-time monitoring via ICCC dashboard → Data integration (stations, meteorology, field reports) → Identification of pollution spikes and sources → Automated alerts and warnings → Targeted interventions (traffic restrictions, construction halts) → Mitigation of health risks and AQI improvement.
Prelims Practice Questions
Q1. Consider the following statements regarding the Air Quality Index (AQI) in India:
1. The AQI is calculated based on the concentration of eight pollutants, including PM2.5, PM10, NO2, SO2, CO, O3, NH3, and Pb.
2. An AQI value above 200 is considered ‘Poor’ as per the National Ambient Air Quality Standards (NAAQS).
3. The AQI is a real-time indicator and does not incorporate meteorological data for its calculation.
How many of the above statements are correct?
- Only one
- Only two
- All three
- None
Answer: Only two — Statement 1 is correct: The AQI in India is calculated using eight pollutants as per the NAAQS. Statement 2 is incorrect: An AQI value above 200 is classified as ‘Very Poor’, while ‘Poor’ ranges from 101 to 200. Statement 3 is incorrect: Meteorological data is crucial for understanding dispersion and accumulation of pollutants, though not directly part of AQI calculation.
Q2. Assertion (A): The Integrated Command and Control Centre (ICCC) in Delhi uses real-time data from multiple sources to monitor air pollution.
Reason (R): The ICCC integrates data from monitoring stations, meteorological departments, construction sites, and industrial activities to assess pollution levels and sources.
In the context of the above two statements, which one of the following is correct?
- Both A and R are true, and R is the correct explanation of A.
- Both A and R are true, but R is not the correct explanation of A.
- A is true, but R is false.
- A is false, but R is true.
Answer: Both A and R are true, but R is not the correct explanation of A. — Both Assertion (A) and Reason (R) are true. The ICCC indeed uses real-time data from multiple sources for pollution monitoring. However, Reason (R) explains the mechanism of how the ICCC operates, which is not the sole reason for the truth of Assertion (A) but provides a detailed justification for it.
Q3. Match the following pollutants with their primary sources of emission:
Pollutant | Primary Source
1. PM2.5 | A. Vehicular emissions
2. PM10 | B. Construction activities
3. NO2 | C. Industrial processes
4. SO2 | D. Burning of fossil fuels
Select the correct match:
- 1-A, 2-B, 3-C, 4-D
- 1-B, 2-A, 3-D, 4-C
- 1-C, 2-D, 3-A, 4-B
- 1-D, 2-C, 3-B, 4-A
Answer: 1-B, 2-A, 3-D, 4-C — PM2.5 is primarily emitted from vehicular emissions (A). PM10 is mainly from construction activities (B). NO2 is primarily from industrial processes (C). SO2 is primarily from burning of fossil fuels (D).
Mains Practice Question
✍ Critically examine the role of real-time air quality monitoring systems in urban pollution governance. How do such systems enhance the efficacy of pollution control measures? Also, analyse the challenges in their implementation and suggest measures to address them. (15 Marks)
Approach: MODEL-ANSWER SKELETON:
1. **Introduction (2 marks)**
– Define real-time air quality monitoring systems (e.g., ICCC in Delhi) and their purpose in urban pollution governance.
– Highlight the significance of such systems in addressing the public health crisis posed by air pollution.
2. **Role in Pollution Governance (5 marks)**
– **Real-time data integration**: Explain how systems like the ICCC integrate multi-source data (monitoring stations, meteorological data, construction/industrial activity) to provide a comprehensive picture of pollution levels and sources.
– **Source apportionment**: Discuss how such systems help identify localised pollution hotspots (e.g., Wazirpur, Narela) and enable targeted interventions.
– **Action-taken reports**: Explain how real-time data forms the basis for dynamic policy responses (e.g., temporary restrictions, field inspections, road-sweeping operations).
– **Public awareness and transparency**: Highlight the role of dashboards in disseminating information to citizens and stakeholders.
3. **Challenges in Implementation (5 marks)**
– **Data accuracy and coverage**: Discuss issues like offline monitoring stations, sensor calibration, and gaps in data transmission (e.g., cameras not transmitting data for six hours).
– **Meteorological limitations**: Explain how poor atmospheric dispersion conditions (e.g., low wind speed) can exacerbate pollution despite monitoring efforts.
– **Institutional and operational challenges**: Highlight the need for round-the-clock monitoring, multi-shift operations, and coordination among agencies (DPCC, IMD, municipal bodies).
– **Technological and financial constraints**: Discuss the costs of setting up and maintaining such systems, including AI-enabled analytics and sensor networks.
4. **Measures to Address Challenges (3 marks)**
– **Strengthening infrastructure**: Expand the network of monitoring stations and ensure redundancy to prevent data gaps.
– **Enhancing inter-agency coordination**: Improve collaboration between pollution control boards, meteorological departments, and municipal authorities.
– **Public participation and awareness**: Encourage citizen science initiatives and community engagement to supplement official monitoring.
– **Policy integration**: Align real-time monitoring with existing frameworks like the National Clean Air Programme (NCAP) and State Action Plans.
5. **Conclusion (2 marks)**
– Summarise the transformative potential of real-time monitoring systems in urban pollution governance.
– Emphasise the need for sustained investment, technological innovation, and institutional capacity-building to address the air pollution crisis.
Source: The Indian Express
Generated by AanyaAi for educational purpose.
Related guides on our sites
- Current affairs for upsc 2026
- Best PSIR optional coaching in delhi for UPSC
- How to prepare for GS paper 1 for UPSC CSE mains exam
- Best UPSC coaching for IFOS exam

- Real-Time Air Pollution Dashboard: India’s Largest Monitoring Centre Explained - October 17, 2026
- विशेष अभियान 6: डीएफपीडी में लंबित मामलों में 70% कमी, रिकॉर्ड प्रबंधन में सुधार - October 17, 2026
- COP31: Can UN Climate Summit Restore Trust Amid Rising Disasters? - October 17, 2026

No Comments