
30 Jan India transitions towards a high-growth and resilient economy
This article covers “Daily Current Affairs” and From India transitions towards a high-growth and resilient economy
SYLLABUS MAPPING
GS-3- Economics- India transitions towards a high-growth and resilient economy
FOR PRELIMS
What does the Index of Eight Core Industries (ICI) measure ?
FOR MAINS
What is the estimated growth rate of agriculture in FY26?
Why in the News?
India enters FY26 with strong economic momentum, supported by stable macroeconomic fundamentals, sustained policy support, and broad-based sectoral performance. Despite a challenging global environment marked by geopolitical tensions, financial market volatility, and uneven global recovery, the Indian economy has demonstrated notable resilience. Robust growth, historically low inflation, improving labour market indicators, and strengthening external and financial buffers underline this performance.
Coordinated fiscal, monetary, and structural policies have reinforced macroeconomic stability while supporting investment, consumption, and inclusion. The emerging macroeconomic environment reflects an economy that is consolidating recent gains while strengthening the foundations for sustained, inclusive, and resilient growth.
State of the Economy
Growth Outlook: GDP and Demand Conditions
India’s growth outlook remains robust, underpinned by strong macroeconomic fundamentals and broad-based demand momentum. As per the First Advance Estimates, real GDP and Gross Value Added (GVA) are projected to grow by 7.4% and 7.3%, respectively, in FY26.
A strong agricultural performance has bolstered rural incomes and consumption, while improving urban demand—supported by tax rationalisation measures—signals a broadening of the consumption base. India’s potential growth is estimated at around 7%, with real GDP growth for FY27 projected in the range of 6.8–7.2%, reflecting sustained medium-term growth capacity despite global headwinds.
Inflation Trends and Outlook
India recorded the lowest inflation rate since the inception of the CPI series, with average headline inflation at 1.7% during April–December 2025, driven by disinflation in food and fuel prices.
Among major Emerging Market and Developing Economies (EMDEs), India witnessed one of the sharpest declines in headline inflation in 2025 compared to 2024—by about 1.8 percentage points. In December 2025, the RBI revised its FY26 inflation forecast downward from 2.6% to 2.0%, supported by a good kharif harvest and healthy rabi sowing. The IMF projects inflation at 2.8% in FY26 and 4.0% in FY27, while the RBI projects headline inflation of 3.9% and 4.0% for Q1 and Q2 of FY27, respectively.
Overall, the inflation outlook remains benign, supported by favourable supply-side conditions and the gradual pass-through of GST rate rationalisation.
Sectoral Drivers of Growth
Agriculture: Stabilising Rural Demand
Agriculture and allied activities continue to play a stabilising role in India’s growth cycle by supporting rural incomes and consumption. The sector is estimated to grow by 3.1% in FY26, supported by a favourable monsoon during H1 FY26. Agricultural GVA expanded by 3.6% in H1 FY26, compared to 2.7% in H1 FY25, reflecting improved crop performance.
Allied activities, particularly livestock and fisheries, recorded stable growth of 5–6%, contributing to resilience and diversification within the rural economy.
Industry and Manufacturing: Momentum Builds
Industrial activity is expected to gain momentum in FY26, with the industrial sector projected to grow by 6.2%, up from 5.9% in FY25. The sector recorded growth of 7.0% in H1 FY26, exceeding both H1 FY25 growth and the pre-COVID trend.
Manufacturing emerged as a key growth engine, with GVA growth accelerating to 7.72% in Q1 and 9.13% in Q2 of FY26, signalling a structural recovery. Government initiatives, particularly Production Linked Incentive (PLI) schemes across 14 sectors, have catalysed investment of over ₹2.0 lakh crore, generated incremental production exceeding ₹18.7 lakh crore, and created more than 12.6 lakh jobs as of September 2025.
India’s innovation ecosystem has strengthened, with its Global Innovation Index rank improving to 38th in 2025, up from 66th in 2019.
Services: The Dominant Growth Engine
The services sector continued to lead growth, expanding by 9.1% in FY26, compared to 7.2% in FY25. Services’ share in GDP rose to 53.6%, while its share in GVA reached a historic high of 56.4% in H1 FY26.
India became the world’s seventh-largest services exporter, with its share in global services trade increasing from 2% in 2005 to 4.3% in 2024. The sector remains the largest recipient of FDI, supported by resilient domestic demand and steady export momentum.
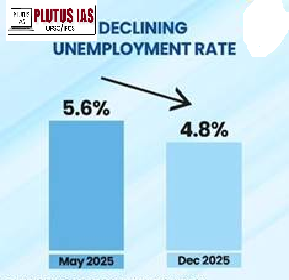
Employment and Labour Market Trends
India’s labour market demonstrated resilience alongside economic expansion. In Q2 FY26, total employment stood at 56.2 crore, with the creation of 8.7 lakh new jobs over the previous quarter.
PLFS indicators show strengthening labour conditions:
LFPR rose to 56.1%
Female LFPR increased to 35.3%
WPR rose to 53.4%
Unemployment rate declined to 4.8%
The Annual Survey of Industries (FY24) reported a 6% increase in organised manufacturing employment, adding over 10 lakh jobs. As of January 2026, the e-Shram portal registered over 31 crore unorganised workers, with women accounting for more than 54%, strengthening targeted welfare delivery.
Trade Performance and External Sector
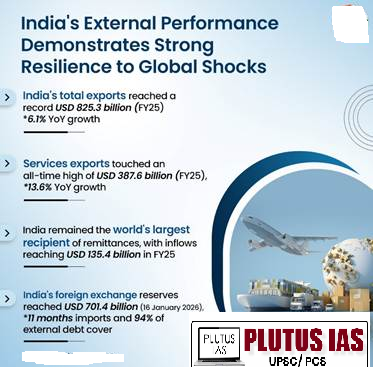
On the trade front, India’s total exports reached record levels of USD 825.3 billion in FY25 and USD 418.5 billion in H1 FY26, driven by strong growth in services exports and sustained momentum in non-petroleum, non-gems and jewellery merchandise exports.
India’s integration into global trade has deepened steadily, marked by diversification of markets and a services-led export profile. India’s share in global merchandise exports increased from 1% in 2005 to 1.8% in 2024, reflecting improved competitiveness and global integration.
According to UNCTAD’s Trade and Development Report 2025, India ranks third among countries in the Global South in terms of the diversity index of trade partnerships, after China and the UAE. India’s index score of 3.2 exceeds that of all countries in the Global North, underscoring its resilience to tariff uncertainties, supply-chain disruptions, and evolving global trade dynamics.
Services exports emerged as a key growth engine, reaching an all-time high of USD 387.5 billion in FY25, registering a robust 13.6% year-on-year growth. This performance reinforced India’s position as a global hub for technology, business, and professional services, with rising demand across IT services, financial services, and other knowledge-intensive segments.
External sector buffers remained strong. Foreign exchange reserves stood at USD 701.4 billion as of 16 January 2026, providing an import cover of around 11 months and covering over 94% of external debt, thereby enhancing India’s ability to withstand external shocks.
India also remained the world’s largest recipient of remittances, with inflows reaching USD 135.4 billion in FY25, offering critical support to the current account balance. Notably, the rising share of remittances from advanced economies reflects the growing global presence of skilled and professional Indian workers.
Industrial Output: IIP and Core Sector Performance
Industrial activity gathered further momentum in December 2025, with broad-based improvement reflected across both the Index of Industrial Production (IIP) and the Index of Eight Core Industries (ICI).
The ICI measures production performance across eight key sectors—coal, crude oil, natural gas, refinery products, fertilizers, steel, cement, and electricity—and serves as a leading indicator of industrial activity. These sectors together account for 40.27% of the total weight of the IIP.
The IIP expanded by 7.8% in December 2025, marking its highest growth in over two years, following robust growth of 7.2% (RE) in November 2025. Manufacturing remained the primary driver, growing by 8.1%, while Mining and Electricity recorded growth of 6.8% and 6.3%, respectively.
Within manufacturing, strong momentum was observed in technology- and mobility-linked segments:
Computer, electronic and optical products: 34.9%
Motor vehicles, trailers and semi-trailers: 33.5%
Other transport equipment: 25.1%
On the core sector front, cement production surged by 13.5% YoY, followed by steel at 6.9%, reflecting sustained demand from construction and infrastructure activities. Other core industries also recorded positive growth, including electricity (5.3%), fertilizers (4.1%), and coal (3.6%), reinforcing the recovery across energy- and input-intensive sectors.
Overall, the synchronised improvement in the IIP and ICI indicates strengthening industrial fundamentals, supported by sustained infrastructure spending, resilient domestic demand, and steady expansion across core and manufacturing industries.
Fiscal Developments
Strengthened Fiscal Credibility and Rating Upgrades
Prudent fiscal management has enhanced confidence in India’s macroeconomic and fiscal framework, reflected in three sovereign credit rating upgrades in 2025 by Morningstar DBRS, S&P Global Ratings, and Rating and Investment Information (R&I), Inc. These upgrades recognise improved revenue buoyancy, credible fiscal consolidation, and sustained public investment.
Improvement in the Centre’s Revenue Receipts
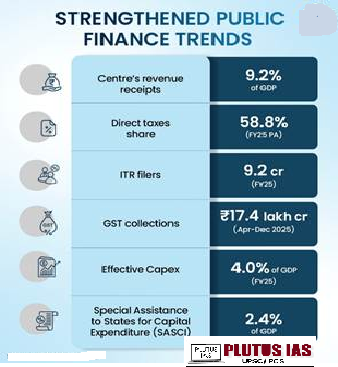
The Centre’s revenue receipts increased from an average of about 8.5% of GDP during FY16–FY20 to 9.2% of GDP in FY25 (PA). This improvement was primarily driven by buoyant non-corporate tax collections, which rose from around 2.4% of GDP in the pre-pandemic period to approximately 3.3% of GDP in the post-pandemic period, reflecting higher formalisation, compliance, and income growth.
Expansion of the Direct Tax Base
The share of direct taxes in total tax revenue increased from 51.9% pre-pandemic to 55.5% post-pandemic, reaching 58.8% in FY25 (PA). The direct tax base expanded steadily, with income tax return filings rising from 6.9 crore in FY22 to 9.2 crore in FY25. This expansion reflects improved tax compliance, greater use of digital tools in tax administration, and the entry of a larger number of individuals into the tax net as incomes rose.
GST Performance and Transaction Activity
Gross GST collections during April–December 2025 amounted to ₹17.4 lakh crore, registering a 6.7% year-on-year growth and broadly tracking nominal GDP trends. High-frequency indicators point to strong underlying transaction activity, with cumulative e-way bill volumes increasing by 21% YoY during the same period, indicating robust movement of goods and sustained economic activity.
Rise in Effective Capital Expenditure
The government’s effective capital expenditure rose from an average of 2.7% of GDP in the pre-pandemic period to about 3.9% post-pandemic, and further to 4.0% of GDP in FY25. This sustained increase underscores the continued emphasis on public investment as a key driver of growth and crowd-in of private investment.
Support to States’ Capital Spending (SASCI)
Through the Special Assistance to States for Capital Expenditure (SASCI), the Centre incentivised States to maintain capital expenditure at around 2.4% of GDP in FY25, strengthening sub-national investment and supporting balanced regional development.
Trends in State Governments’ Fiscal Deficit
The combined fiscal deficit of State Governments remained broadly stable at around 2.8% of GDP in the post-pandemic period, similar to pre-pandemic levels, but rose to 3.2% of GDP in FY25, reflecting emerging pressures on State finances amid higher expenditure commitments.
Reduction in General Government Debt Ratio
India reduced its general government debt-to-GDP ratio by about 7.1 percentage points since 2020, while continuing to maintain elevated levels of public investment. This reflects a calibrated approach combining fiscal consolidation with growth-supportive expenditure.
Financial Sector and Monetary Developments
India’s monetary and financial sectors recorded strong performance during FY26 (April–December 2025), despite heightened uncertainty in global financial markets. In an increasingly fragmented global financial environment, India’s robust regulatory framework, institutional resilience, and growing reliance on domestic financial channels played a stabilising role. Supported by proactive monetary management and effective financial intermediation across channels, the financial system remained stable and well-positioned to absorb external shocks.
Monetary Policy Actions and Liquidity Management
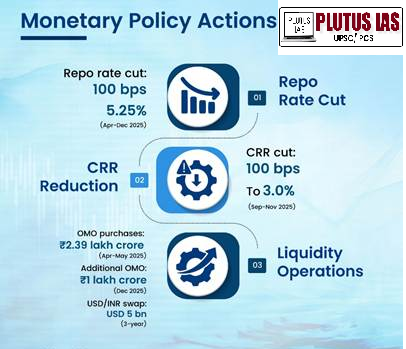
In response to evolving macroeconomic and financial conditions, the Reserve Bank of India’s Monetary Policy Committee (MPC) cumulatively reduced the policy repo rate by 100 basis points between April and December 2025, bringing it to 5.25%. These calibrated reductions were aimed at improving credit flow, stimulating investment, and supporting overall economic activity.
Complementing policy rate cuts, the RBI reduced the cash reserve ratio (CRR) by 100 basis points to 3.0% during September–November 2025. In addition, the RBI injected durable liquidity of ₹2.39 lakh crore through open market operations (OMOs) during April–May 2025, followed by further OMO purchases of ₹1 lakh crore and a 3-year USD/INR buy-sell swap of USD 5 billion in December 2025.
As a result, system liquidity remained in surplus, averaging ₹1.89 lakh crore in FY26 (up to 8 January 2026), compared to a marginal surplus of ₹1,605 crore in FY25, reflecting an accommodative liquidity environment.
Monetary Aggregates and Credit Transmission
Reserve money growth moderated to 2.9% by December 2025, from 4.9% in December 2024. However, CRR-adjusted reserve money growth increased to 9.4%, compared to 6.2% a year earlier, reflecting the expansionary monetary stance.
Broad money (M3) growth accelerated to 12.1%, up from 9% a year ago, indicating that banks effectively utilised the liquidity released through CRR reductions. This expansion was driven primarily by growth in aggregate bank deposits, the largest component of broad money.
The money multiplier rose to 6.21 in December 2025, from 5.70 a year earlier, signalling improved financial intermediation and efficient transmission of liquidity within the banking system.
Banking Sector Performance and Credit Dynamics
The banking sector strengthened further in FY26, with gross non-performing asset (GNPA) ratios declining to multi-decadal lows and net NPAs reaching record low levels. The capital-to-risk-weighted assets ratio (CRAR) of scheduled commercial banks (SCBs) remained robust at 17.2% as of September 2025, underscoring strong capital adequacy.
Bank profitability improved further. Profit after tax of SCBs increased by 16.9% in FY25 and by 3.8% year-on-year as of September 2025. Return on equity stood at 12.5%, while return on assets reached 1.3%, reflecting enhanced operational efficiency.
After moderating earlier in FY26, credit growth regained momentum, with outstanding SCB credit expanding by 14.5% (YoY) in December 2025, compared to 11.2% in December 2024. December 2025 recorded the highest year-on-year growth rates for both bank credit and non-food credit during FY26.
Credit growth to MSMEs remained particularly robust, expanding by 21.8% in November 2025. Within this segment, micro and small enterprises recorded credit growth of 24.6% (YoY), up sharply from 10.2% in November 2024, highlighting improved access to formal finance.
Improving Financial Inclusion Metrics
The RBI’s Financial Inclusion (FI) Index, which tracks progress across 97 indicators spanning access, usage, and quality of financial services, improved from 64.2 in March 2024 to 67.0 in March 2025. The improvement reflects sustained gains in banking outreach, digital payments, credit access, insurance penetration, and pension coverage.
Capital Markets and Household Financialisation
Capital markets continued to play an expanding role in capital formation. During FY26 (up to December 2025), total resource mobilisation from primary markets stood at ₹10.7 lakh crore. Over the five-year period from FY22 to FY26 (till December 2025), primary markets mobilised ₹53 lakh crore through equity and debt issuances.
Household financial savings increasingly shifted towards market-linked instruments. Individual investors’ share in equity ownership rose to 18.8% by September 2025, while household equity wealth increased by approximately ₹53 lakh crore between April 2020 and September 2025. The share of equity and mutual funds in annual household financial savings increased from about 2% in FY12 to over 15.2% in FY25, reflecting deeper financialisation and growing investor participation.
Conclusion
Macroeconomic trends in FY26 reflect an economy characterised by stability alongside momentum. Growth remains broad-based across agriculture, industry, and services, while inflation has moderated and labour market conditions have improved. A strong external sector, robust fiscal consolidation combined with sustained capital expenditure, and a resilient financial system provide buffers against global uncertainties. Together, these developments position India favourably for sustained, inclusive, and resilient medium-term growth.
Best ias coaching in delhi Best ias coaching in chandigarh
Prelims question:
Q. Consider the following statements regarding India’s economic performance in FY26 :
1.India recorded its lowest CPI inflation since the inception of the CPI series during April–December 2025.
2.Services sector accounts for more than half of India’s GDP and GVA.
3.India’s foreign exchange reserves provide import cover of more than 10 months.
4.The Index of Eight Core Industries has a weight of more than 50% in the Index of Industrial Production.
Which of the statements given above are correct ?
(a) 1, 2 and 3 only
(b) 1 and 4 only
(c) 2, 3 and 4 only
(d) 1, 2, 3 and 4
Answer: A
Q. Examine the significance of declining inflation and improved labour market indicators for inclusive growth in India.
(250 words)
- Artemis II: Humanity’s Return to Lunar Space and India’s Place in the New Moon Race - April 2, 2026
- A Missed Opportunity to Guarantee Minimum Wages - March 31, 2026
- ‘India’s Growth Claims, A Clash with Data Reality’. - March 30, 2026

No Comments